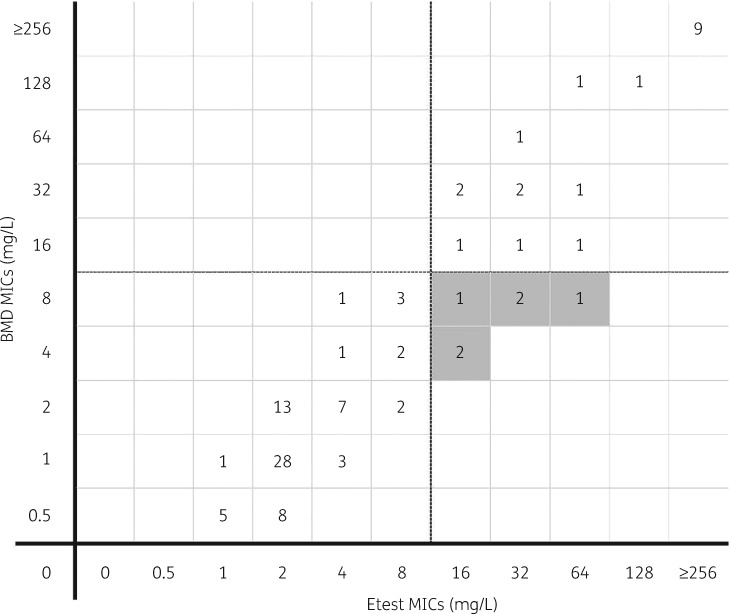
Figure 1.
Distribution of ceftazidime/avibactam MICs by BMD and Etest against all 102 Gram-negative isolates evaluated. The horizontal and vertical dashed lines (between 8 and 16 mg/L on the x- and y-axes) represent the MIC susceptibility breakpoint. Shaded boxes indicate MEs (false resistance) as reported by the Etest compared with BMD.

