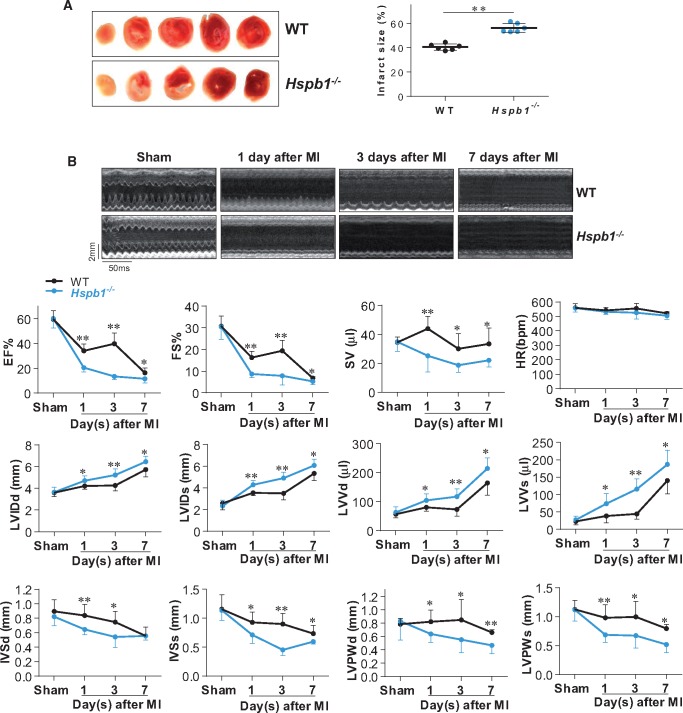
Figure 3.
Deficiency of HSPB1 enlarged infarct size and worsened cardiac dysfunction and remodelling. (A) Infarct size. Infarct size was evaluated by TTC staining 24 h post-MI. The red area resembled the vital myocardium and the white area indicated the infarct. Data were expressed as mean ± SD and analysed using unpaired t-test. **P < 0.01, n = 6/group. (B) Cardiac dysfunction and remodelling. Cardiac function and remodelling was examined serially using 2D echocardiography. The representative M-mode images at the papillary muscles were shown in upper panel. Parameters were obtained from M-mode tracings and averaged using three to five cardiac cycles. Data were expressed as mean ± SD and analysed using two-way ANOVA analysis followed by post hoc test. **P < 0.01 and *P < 0.05 vs. the time-matched WT mice, n = 8 for all the groups except for n = 6 in Hspb1−/− mice with MI for 7 days. Time stamp and scale bar of M-mode images were shown in the figure. EF (%), ejection fraction; FS (%), fractional shortening; SV (μL), stroke volume; HR (b.p.m.), heart rate; LVIDd (mm), left ventricular internal diameter at diastolic phase; LVIDs (mm), left ventricular internal diameter at systolic phase; LVVd (μL), left ventricular end-diastolic volume; LVVs (μL), left ventricular end-systolic volume; IVSd (mm), interventricular septal thickness at diastolic phase; IVSs (mm), interventricular septal thickness at systolic phase; LVPWd (mm), left ventricular posterior wall thickness at diastolic phase; LVPWs (mm), left ventricular posterior wall thickness at systolic phase.

