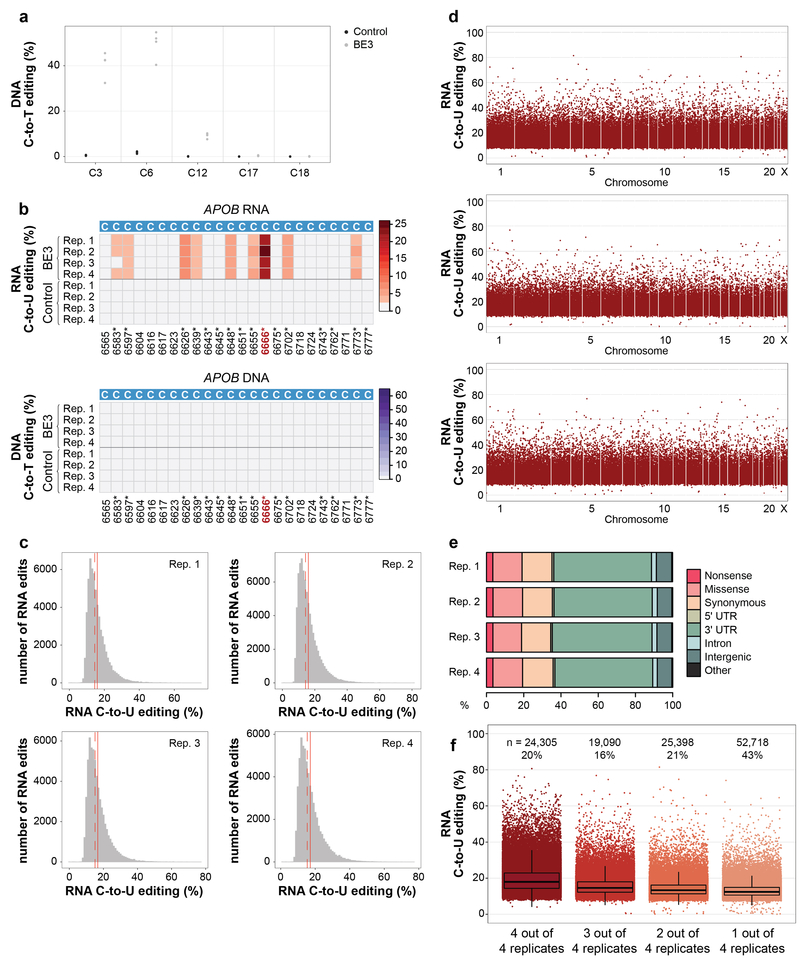
Extended Data Figure 1. Additional data and analysis for transcriptome-wide off-target C-to-U RNA editing induced by BE3 in human HepG2 cells.
(a) Dot plot of RNF2 on-target DNA editing data shown in Fig. 1b, depicting editing frequencies for all cytosines across the spacer sequence. (b) Heat maps showing RNA and DNA editing efficiencies of BE3 and Control on cytosines in human APOB. Numbering indicates nucleotide positions in the APOB transcript with asterisks by those previously shown to be modified by APOBEC1. (c) Histograms showing numbers of RNA edited cytosines (y-axis) with RNA C-to-U editing frequencies (x-axis) for the four replicates shown in Fig. 1c. Dashed red line shows the median, solid red line represents the mean. (d) Manhattan plots of data for replicates 2, 3, and 4 from Fig. 1c showing the distribution of modified cytosines across the transcriptome. n = total number of modified cytosines observed. (e) Percentages of different predicted effects and locations of edited cytosines in each RNA-seq replicate. (f) Jitter plots of cytosines modified by BE3 expression with the RNF2 gRNA categorized by their presence in 4, 3, 2 or 1 of the replicate RNA-seq experiments performed in HepG2 cells (n=4 biologically independent samples, same as in Fig. 1c). The box spans the interquartile range (first to third quartiles), with the band inside the box depicting the median (second quartile). The whiskers extend to the ±1.5 * interquartile range. n = total number of modified cytosines present in each category. The percentage of all modified cytosines in each category is also shown. UTR = untranslated region.

