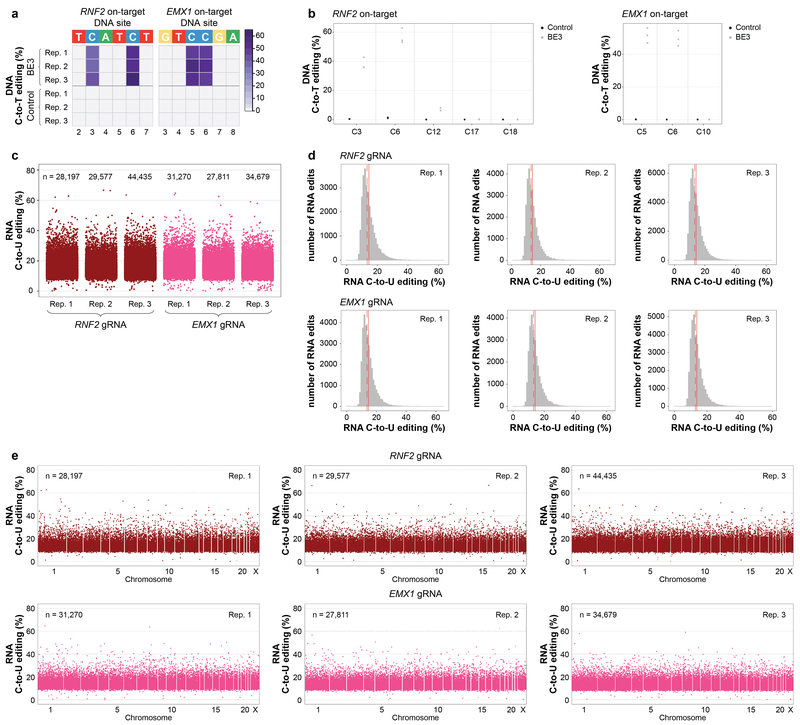
Extended Data Figure 2. BE3 expression with two different gRNAs induces transcriptome-wide off-target RNA editing in HEK293T cells.
(a) Heat maps of on-target DNA base editing efficiencies of BE3 and nCas9-UGI-NLS (Control) in HEK293T cells (all GFP sorting) determined in triplicate with the RNF2 or EMX1 gRNA. Bases shown are within the editing window of the on-target spacer sequence (numbering is at the bottom with 1 being the most PAM distal spacer position). (b) Dot plots of RNF2 and EMX1 on-target DNA editing data shown in (a), depicting editing frequencies for all cytosines across the spacer sequence. (c) Jitter plots derived from RNA-seq experiments showing RNA cytosines modified by BE3 expression with the RNF2 or EMX1 gRNA. Y-axis represents the efficiencies of C-to-U editing. n = total number of modified cytosines observed in each replicate. (d) Histograms showing numbers of RNA edited cytosines (y-axis) with RNA C-to-U editing frequencies (x-axis) for the experiments shown in (c). Dashed red line shows the median, solid red line represents the mean. (e) Manhattan plots of data shown in (c) depicting the distribution of modified cytosines across the transcriptome. n = total number of modified cytosines observed.

