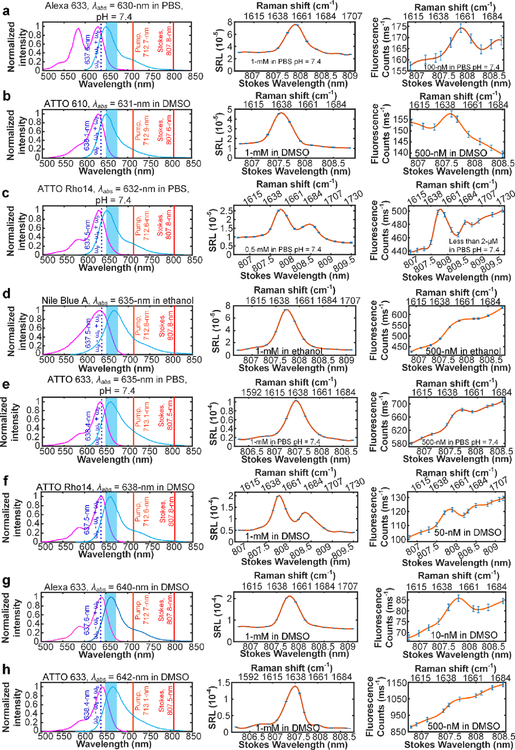
Fig. 3. SREF excitation with the total SREF excitation energy ((ωp - ωs) + ωp) within the proper-electronic pre-resonance region.
Right column shows the SREF excitation and signal collection diagrams for Alexa 633 (Carboxy) in PBS (pH = 7.4), ATTO 610 (NHS ester) in DMSO, ATTO Rho14 (NHS ester) in PBS (pH = 7.4), Nile Blue A in ethanol, ATTO 633 (NHS ester) in PBS (pH = 7.4), ATTO Rho14 (NHS ester) in DMSO, Alexa 633 (Carboxy) in DMSO, ATTO 633 (NHS ester) in DMSO, respectively. In these panels, purple curves and blue curves show the absorption and emission spectra in corresponding solvents, respectively; The dark red, light red and dash blue lines show the corresponding wavelength positions of Stokes beam (ωs), pump beam (ωp) and total excitation energy ((ωp - ωs) + ωp), respectively; and the blue bands show the fluorescence collection band of filter set (FF01-661/20, Semrock). All laser lines and CARS lines ((ωp - ωs) + ωp) are avoided. Center column shows the SRS spectra of corresponding dyes. And all SRS spectra are measured under 2.5-mW pump power and 13-mW Stokes power. Left column shows the SREF spectra of corresponding dyes. All SREF spectra was measured under 6-mW pump power and 13-mW Stokes power. Concentrations and solvents are marked in corresponding panels, respectively. The concentration of the right panel of (c) is unknown because of the strong absorption of ATTO Rho14 (initially 2-μM in PBS) on the coverslip and spacer, which results to obvious decreasing of the concentration.

