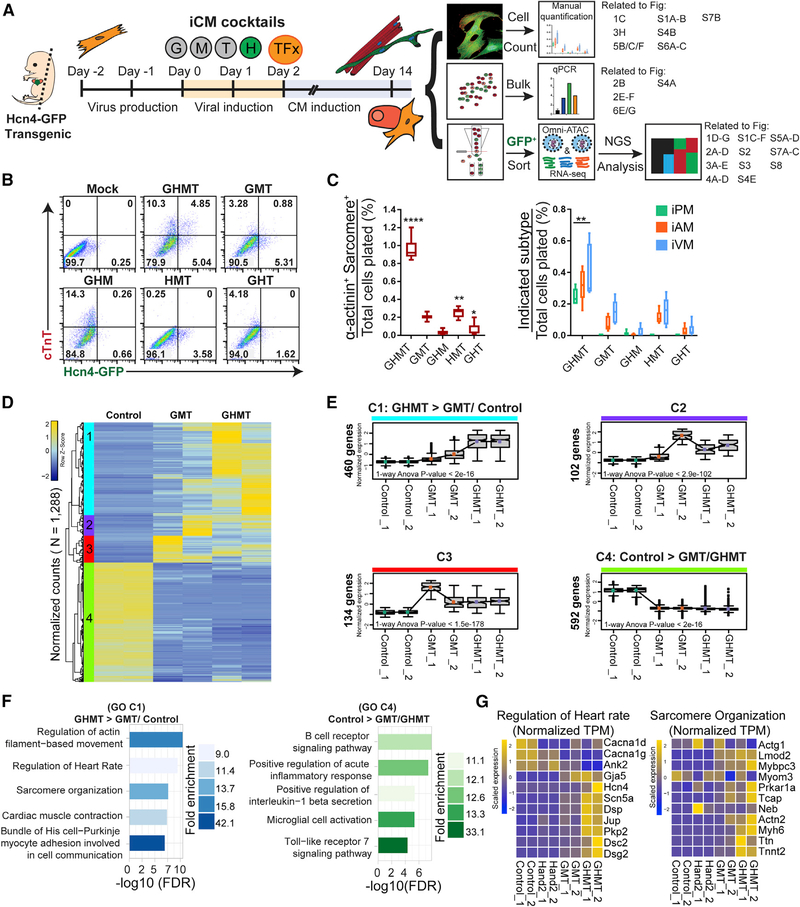
Figure 1. Hand2 Facilitates Transcriptional Reprogramming of Induced Pacemaker (iPM) Cells.
(A) Experimental scheme for iPM reprogramming, which was analyzed in three independent workflows. Specific figure panels corresponding to each workflow are indicated to the right.
(B) MEFs were transduced with GHMT or each three-factor combination followed by flow cytometry analysis at day 10.
(C) Same experimental setup as in (B) but assayed by ICC and manual counting (means ± SD, n = 6) at day 14. All samples were compared with GMT to determine statistical significance.
(D) RNA-seq analysis was performed on control, GMT-infected, and GHMT-infected MEFs. Unsupervised hierarchical clustering of these genes highlights four distinct clusters (1–4).
(E) Gene expression for each cluster in (D) is shown for individual samples. p values for 1-way ANOVA testing across samples are shown within individual boxplots. Statistical testing for pairwise comparisons within a given cluster was performed by Tukey’s honestly significant difference (HSD) test between groups. All comparisons were significant, except for GHMT versus GMT in clusters 2 and 4. All numerical values for Tukey’s HSD testing are provided in Table S2.
(F) Gene ontology (GO) analysis for clusters 1 and 4.
(G) Gene-level view of RNA-seq data comprising “regulation of heart rate” and “sarcomere organization” GO terms across samples.
Statistical significance indicated as follows: *p < 0.05, **p < 0.01, ***p < 0.001, ****p < 0.0001. Non-significant comparisons indicated either by “ns” or no asterisk.

