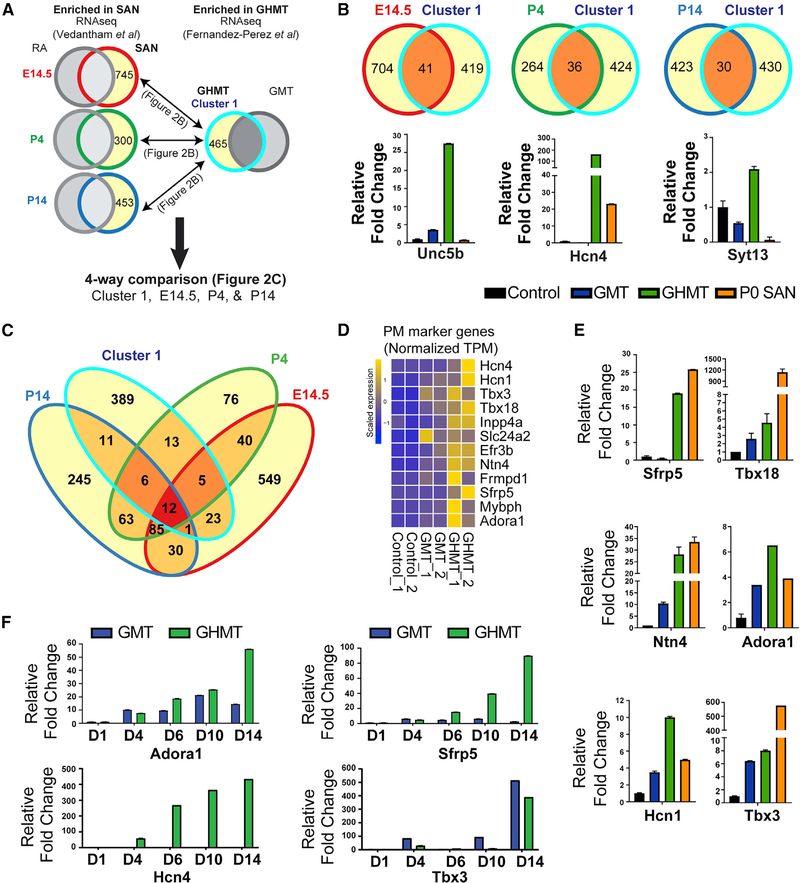
Figure 2. Core Endogenous Pacemaker Marker Genes Are Enriched in iPMs.
(A) Analytical strategy for comparing iPM-specific genes with sinoatrial node (SAN)-specific genes in (B) and (C). Gene sets enriched in SAN compared with RA at14.5, P4, and P14 (red, green, or dark blue outline with yellow interior) were obtained from Vedantham et al. (2015). Gene sets enriched in GHMT- versus GMT- reprogrammed cells (light blue outline with yellow interior) were obtained from this study. Then, pairwise comparisons for overlapping genes at individual developmental time points were done in (B), whereas a four-way comparison for overlapping genes among all gene sets was performed in (C).
(B) Top: Venn diagrams demonstrating numbers of shared genes between iPMs and each developmental time point. Bottom: qRT-PCR for individual candidate genes in each group is shown.
(C) Four-way Venn diagram shows a core set of 12 pacemaker marker genes (dark red).
(D) RNA-seq data for pacemaker marker genes across reprogrammed MEF samples.
(E) qRT-PCR validation of a subset of pacemaker marker genes with micro-dissected mouse SAN tissue as a positive control.
(F) qRT-PCR time course of GMT- and GHMT-transduced MEFs.

