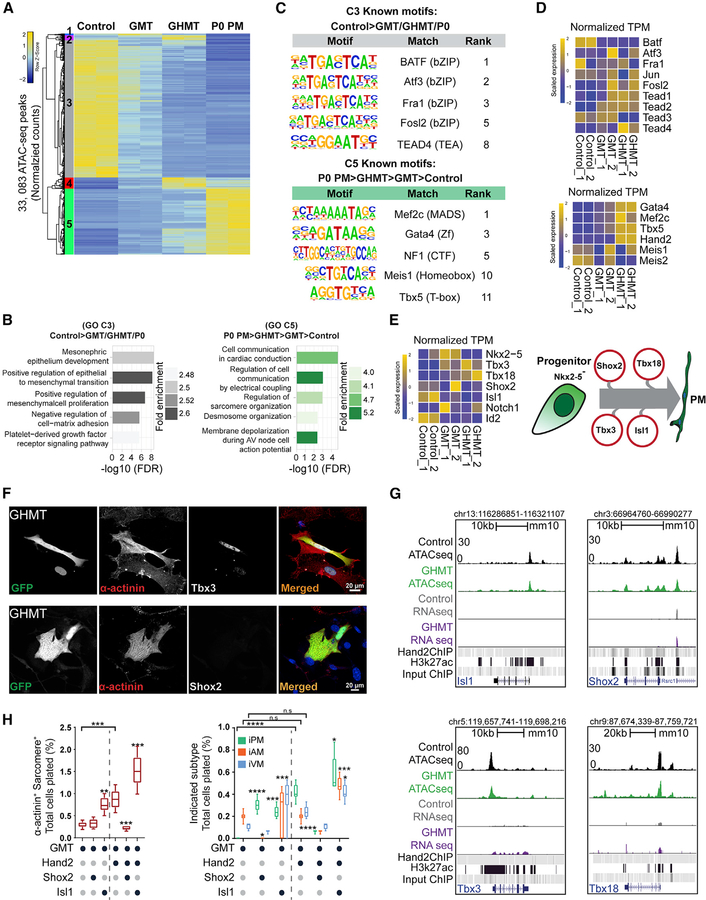
Figure 3. Hand2 Reorganizes Chromatin Accessibility toward a Pacemaker-like State.
(A) ATAC-seq was performed on control, GMT-infected, and GHMT-infected MEFs, and P0 Hcn4-GFP+ endogenous pacemaker (P0 PM) cells were profiled for comparison. Unsupervised hierarchical clustering separated chromatin peaks into five clusters (1–5).
(B) Gene ontology (GO) term analysis of clusters 3 and 5.
(C) Known transcription factor motifs identified for clusters 3 and 5.
(D) RNA-seq enrichment of candidate transcription factors (TFs) for clusters 3 and 5.
(E) Cartoon diagram of the developmental pacemaker gene regulatory network (right) and associated RNA-seq data (left).
(F) Immunocytochemistry (ICC) on GHMT-reprogrammed cells for Tbx3 (top) and Shox2 (bottom). Scale bar, 20 mm.

