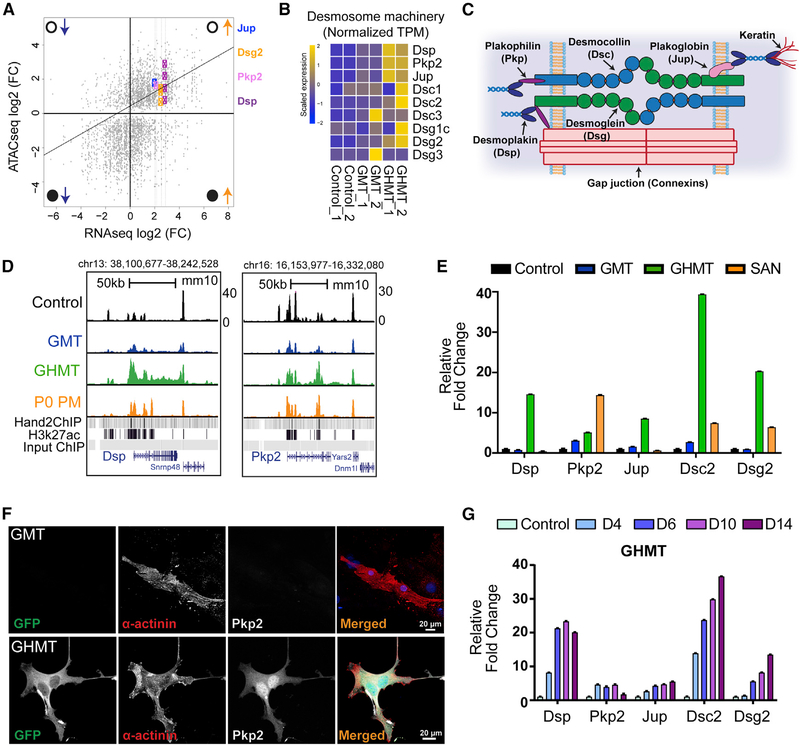
Figure 6. Hand2 Coordinates Activation of the Desmosome Machinery.
(A) Integrated analysis of RNA-seq (x axis) and ATAC-seq (y axis) data between GHMT- and GMT-transduced MEFs. Open and closed circles denote open and closed chromatin, whereas upward and downward pointing arrows indicate increased and decreased gene expression. Gene loci are labeled with colored symbols and corresponding gene names.
(B) RNA-seq heatmap for genes that comprise the desmosome machinery in control, GMT-infected, and GHMT-infected MEFs.
(C) Cartoon diagram of the desmosome complex.
(D) Genome browser tracks for Dsp and Pkp2 loci with corresponding ATAC-seq tracks derived from control, GMT, GHMT, and P0 PM samples. Hand2 and E10.5 heart H3K27 ChIP-seq peaks are provided as a reference.
(E) qRT-PCR confirmation that desmosome genes are enriched in iPMs.
(F) ICC validation of Pkp2 protein expression in GHMT, but not GMT, transduced MEFs. Scale bar, 20 mm.
(G) Kinetics of desmosome gene expression during iPM formation demonstrated by qRT-PCR analysis.

