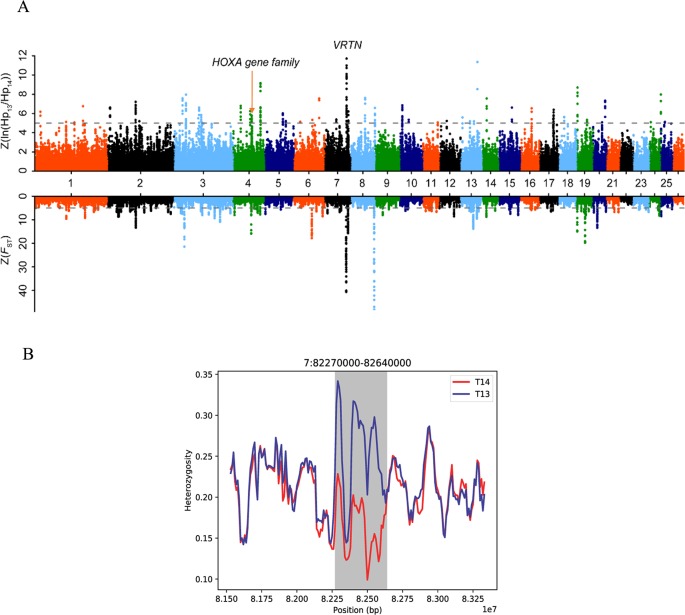
Figure 2.
Selection analyses identified 11 candidate breeding regions. (A) Z(F ST) distributions plotted along sheep chromosomes 1–26 (chromosomes separated by color). The horizontal dotted line indicates the cutoff value used to extract outliers (Z > 5) (top part). Draw the Z (ln(H P13/H P14)) distribution along goat autosomes 1–26 (chromosomes separated by color). The horizontal dotted line indicates the cutoff value (Z > 5) used to extract outliers (bottom part). (B) Pooled heterozygosity (H P) in 45-kb sliding windows with 10-kb steps in T14 (red line) and T13 sheep (blue line) from 82.27 to 82.64 Mb on chromosome 7.

