Figure 3.

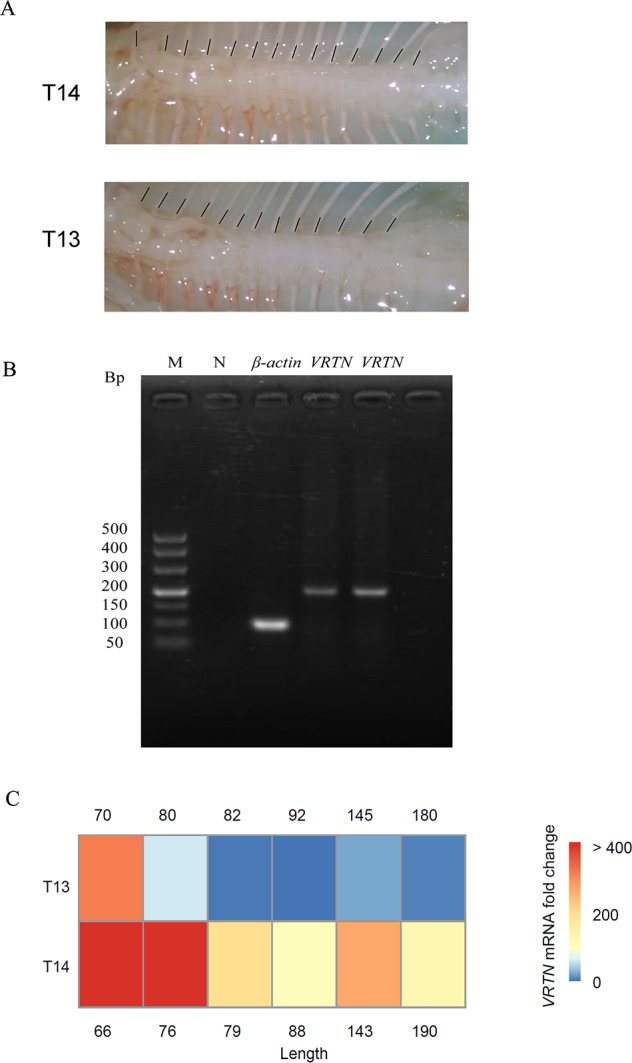
Analysis of VRTN gene expression levels in different fetal stages for two spine traits. (A) Legend of spine traits during fetal development: T14 (top) and T13 (bottom). (B) Reverse transcription Polymerase Chain Reaction (RT-PCR) amplification of β-actin and VRTN (on the left is T13 and on the right is T14, both from the same period of fetal sheep). The order of electrophoresis is marker (TaKaRa DL500; 500, 400, 300, 200, 150, 100, and 50 bp), negative control, β-actin, and VRTN. (C) Heat maps of VRTN gene expression in T13 (top) and T14 (bottom) fetuses (p < 0.05). Red indicates high expression, and green indicates low expression. β-Actin was used as a control. The numbers on either side represent the length of the fetus. The unit is mm.
