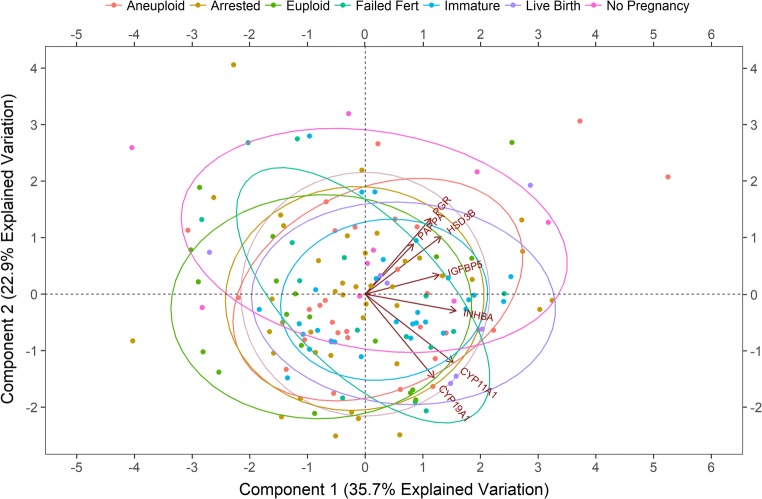
Fig. 2.
Principal component analysis biplot for CC mRNA expression. Biplot of the log2-transformed mRNA levels for 7 genes from 14 patients along the first and second principal components (PC1 and PC2). PC1 accounted for 35.7% of the observed variance while PC2 accounted for 22.9% of the variance. Each data point represents an individual CC mass mRNA level associated with an individual oocyte (n = 151 oocytes). The biplot demonstrates the relationship between individual CC mRNA level patterns and the correlation between the different genes. The closer the data points are to each other, the more similar the normalized CC gene expression patterns. The closer the arrows are to each other, the higher the correlation between the normalized CC gene expressions. Groups represent CC mRNA from oocytes with the following descriptions: aneuploid = mature oocytes resulting in aneuploid embryos; arrested = mature oocytes resulting in embryos that did not reach the blastocyst stage; euploid = mature oocytes resulting in euploid blastocysts that were not transferred; failed fert = mature oocytes that did not fertilize; immature = immature oocytes that were not fertilized; live birth = oocytes that resulted in euploid embryos that resulted in live births; no pregnancy = oocytes that resulted in euploid embryos that did not result in a pregnancy

