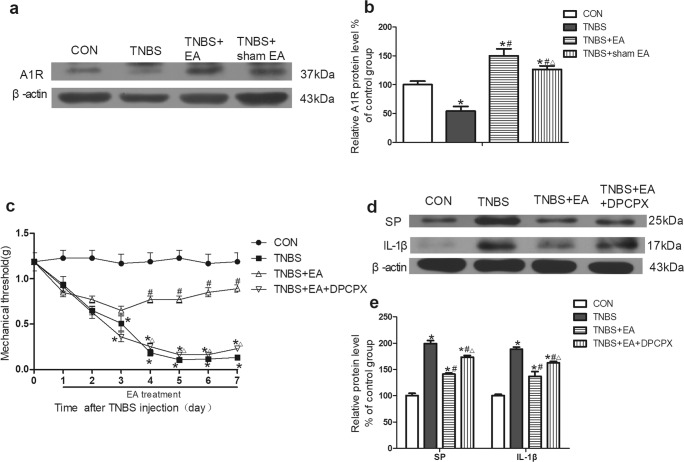
Fig. 3.
Role of A1R in the effect of EA on TNBS-induced mice. a Representative gel images of A1R in colon tissue. β-Actin was used as a loading control. b Summary data of A1R in colon tissue. c Time course of the mechanical withdrawal threshold when used A1R antagonist. d Representative gel images of SP and IL-1β in colon tissue. β-Actin was used as a loading control. e Summary data of SP and IL-1β in colon tissue. Data were expressed as the means ± SEM (n = 10 mice per group). *P < 0.05, compared with the control group; #P < 0.05, compared with the TNBS group; △P < 0.05, compared with the TNBS+EA group

