Fig. 3.
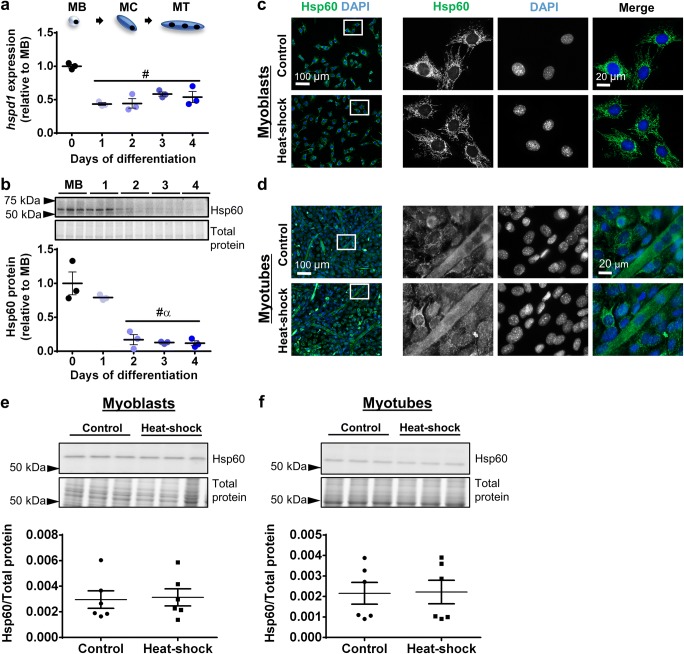
Hsp60 gene expression, protein expression, and subcellular localization in proliferating and differentiating C2C12 cells. a The mRNA expression of gene encoding Hsp60 (hspd1) was examined qPCR in MB and at days 1–4. Gene transcript levels were normalized to cDNA content and expressed relative to MB levels. b Representative Western blot showing protein expression of Hsp60 in MB and at days 1–4. Densitometry values were normalized to total protein and expressed relative to MB levels. Individual data points and the mean (horizontal line) ± SEM shown; n = 3 replicates/timepoint. #P < 0.05 vs. MB; αP < 0.05 vs. day 1. c–d Representative immunofluorescence images of C2C12 myoblasts (c) and myotubes (d) stained with DAPI and endogenous Hsp60 in the absence of (control; top row) and after heat-shock treatment at 42 °C for 2 h (bottom row). Scale bars as indicated. Boxed regions shown at higher magnification. e–f Western blot analysis showing protein expression of Hsp60 in lysates prepared from control and heat-shock-treated myoblasts (e) and myotubes (f). Densitometry values were normalized to total protein content assessed from the stain free gel image. Individual data points and the mean (horizontal line) ± SEM are shown; n = 6 replicates/timepoint

