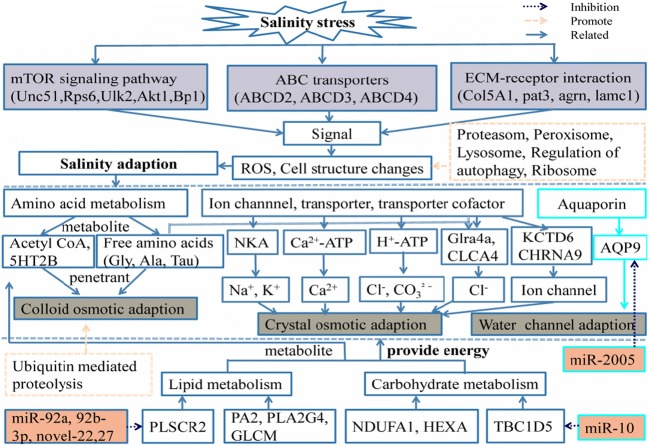
Fig. 4.
A hypothetical model depicting the components involved in the sea cucumbers salt-responsive networks was established. The purple rectangular box of the figure represents the pathway involved after salt stress; the gray rectangular box represents the possible three salinity adaption modes, and the orange rectangular box represents the related miRNAs

