. 2019 May 28;10(28):6799–6808. doi: 10.1039/c9sc00343f

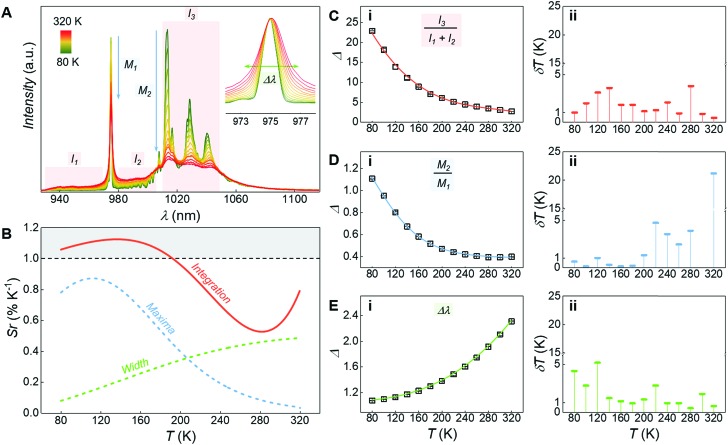
Fig. 5. (A) Emission spectra arising from the YbIII : 2F5/22F7/2 transition recorded under 375 nm excitation at different temperatures (from 80 to 320 K). In the inset, a zoom-in of the 0′–0 Stark component is shown. (B) Sensitivities (Sr) of the optothermometric approache relying on the three different thermometric parameters (Δ). In (C–E) the thermometric parameters for the three optothermometric approaches are reported (C(i) – ratio between integrated regions I1, I2, and I3; D(i) – ratio between 0′–0 and 0′–1 Stark components; E(i) – 0′–0 peak width) along with the respective fits (C(i) and E(i) – cubic function; D(i) – Boltzmann function; as implemented in OriginPro® software), and their associated uncertainties (ii). In A, red shaded areas indicate the integration ranges (I1, I2, I3) used for the first luminescence thermometry approach, blue arrows evidence the intensity drop of the Stark components used for the second approach, and the green double-headed arrow in the inset highlights the broadening of the 0′–0 Stark component upon increasing the temperature. In B, the region for Sr > 1 % K–1 is highlighted with a grey-shaded area.

Fig. 5