. 2019 May 20;10(28):6748–6769. doi: 10.1039/c9sc01184f

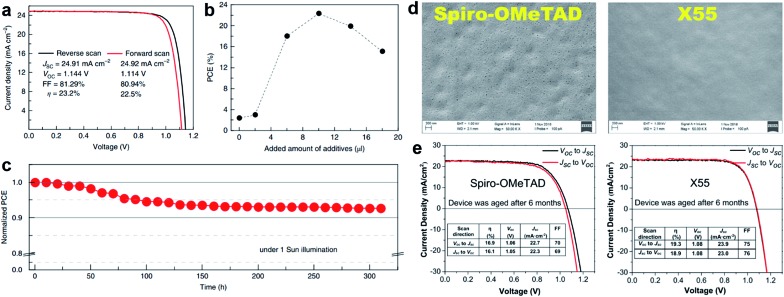
Fig. 8. (a) JV curves measured by reverse and forward scans of the best cell using DM with active area of 0.0939 cm2; (b) relationship between the power conversion efficiency and the amount of additive added to DM. The added amount of additives indicates the sum amount of LiTFSI solution in acetonitrile (340 mg ml–1) and pure tBP with a 1 : 1 volume ratio; (c) evolution of normalized power conversion efficiency obtained from a DM-based device with encapsulation under maximum power point tracking and continuous light irradiation (AM 1.5 G, 100 mW cm–2, white LED) at 25 °C. Initial efficiency is 20.8% with a JSC of 24.3 mA cm–2, a VOC of 1.11 V and a FF of 76.8%, which were measured from the JV curves. Reprinted with permission from ref. 95. (d) Scanning electron microscopy (SEM) images of the HTM layer (top view); (e) JV characteristics of spiro-OMeTAD and X55 based PSCs under different scan conditions after aging for 6 months. Reprinted with permission from ref. 101.

Fig. 8