
FIGURE 6.
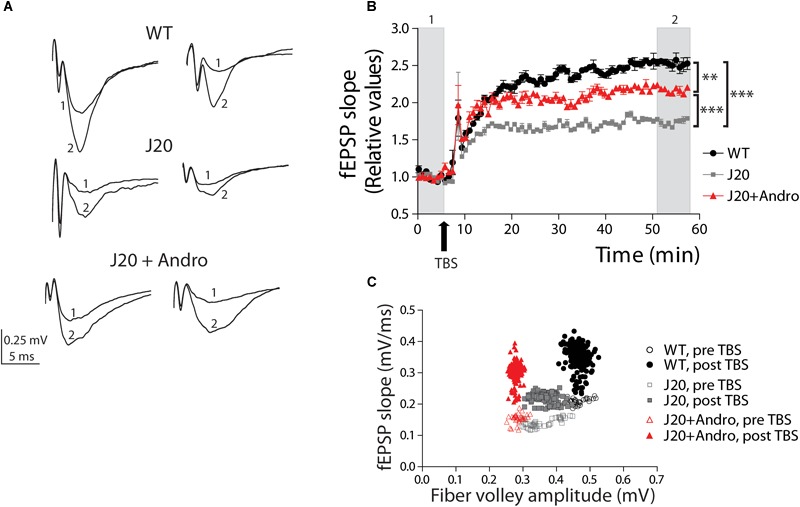
Pretreatment with ANDRO increases the level of LTP. Two representative traces of field EPSPs (A) recorded before (1) and after LTP induction (2) in each animal group. WT (black dots), J20 (gray squares), and J20+ANDRO (red triangles). Twenty minutes of basal activity was recorded (B) before LTP was induced by theta burst stimulation (TBS, arrow), as explained in the “Results” Section. The fEPSPs slope measurements after LTP induction were normalized to the slope measurements during basal time. Treatment with ANDRO increased the amount of LTP compared to J20, but to a lesser extent than WT. After TBS, comparing the averages of the last 10 min among groups, all three curves become significantly different (one-way ANOVA, p < 0.001, followed by Bonferroni post hoc test WT vs. J20, ∗∗∗p < 0.001; WT vs. J20+ANDRO, ∗∗p < 0.01; J20 vs. J20+ANDRO, ∗∗∗p < 0.001). (C) Correlation plot between FV amplitude and fEPSP slope before and after LTP induction. WT: pre-TBS (open black circles), post-TBS (solid black circles); J20: pre-TBS (open gray squares), post-TBS (solid gray squares); J20+ANDRO: pre-TBS (open red triangles), post-TBS (solid red triangles). The correlation between FV amplitude and fEPSP slope was found using Pearson’s correlation. Using Fisher ‘r’ to ‘z’ transformation, we used z-scores to compute the significance of the difference when we compare two correlation coefficients before TBS (open symbols). The same analysis was performed to compare correlation coefficients after TBS (closed symbols). After LTP induction, we found significant differences in all group comparisons (for details, see main text). Data represents the mean ± SEM from 16 slices of 8 (WT) mice; 18 slices of 6 (J20) mice; 18 slices of 6 (J20+Andro) mice. Further details, see Section “Materials and Methods.”