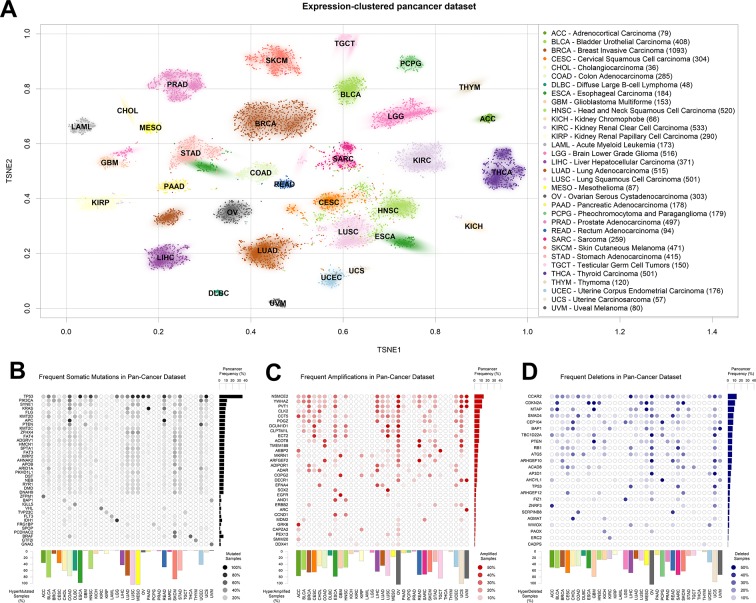
Figure 1.
The Cancer Genome Atlas (TCGA) dataset used. (A) T-distributed stochastic neighbor embedding (TSNE) clustering of TCGA samples based on gene expression profiles. The 2D median of each tumor type is indicated using the TCGA tumor code. Subset size is indicated in brackets next to tumor type names to the right. (B) Table of most somatically mutated genes across TCGA tumor samples, in terms of number of samples where the gene is somatically mutated with altered protein product sequence. (C) Table of most amplified genes across TCGA tumor samples. (D) Table of most deleted genes across TCGA tumor samples. The fraction of total TCGA samples carrying a gene-targeting event is indicated to the right of panels (B–D), and the fraction of samples where more than 0.5% of the genes is affected by the panel event type is indicated to the bottom of panels (B–D).

