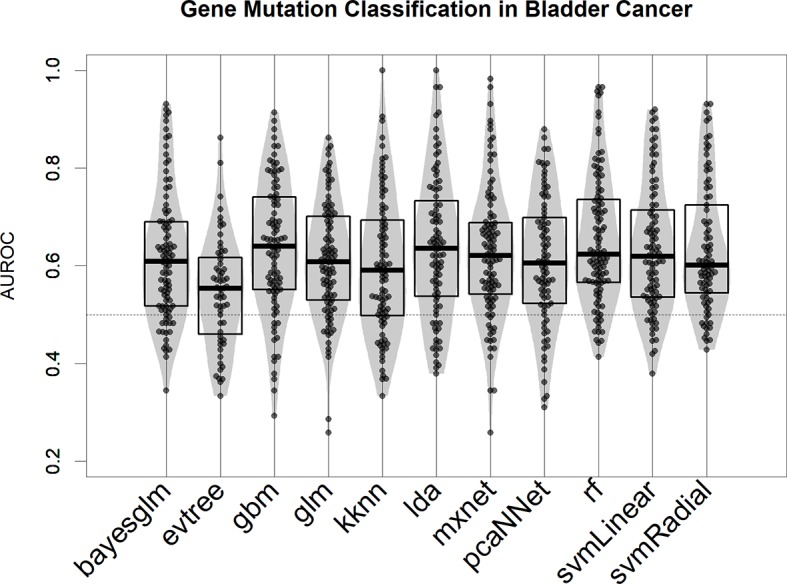
Figure 2.

Performance of 11 machine learning algorithms in binary classification of mutated/nonmutated samples using gene expression predictor variables in the bladder cancer dataset. Each point corresponds to a specific mutation/model. Performance is indicated as AUROC: area under the receiver operating characteristic curve.
