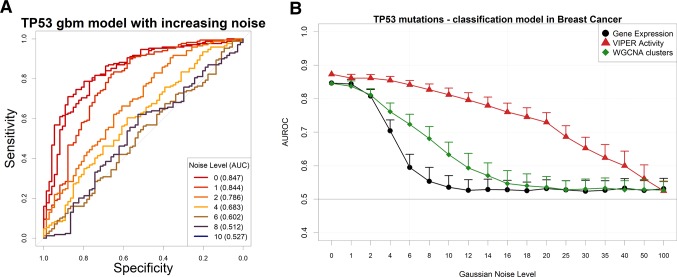
Figure 4.
Performance of a TP53 somatic mutation gbm model upon Gaussian noise addiction. (A) Receiver operating characteristic (ROC) curves (and area under the curve) upon addition of increasing levels (in terms of SD of a Gaussian distribution with mean = 0) of Gaussian noise. (B) AUROCs of the model with increasing noise, calculated using gene expression (black line) or aggregated gene expression using the WGCNA (green line) or VIPER (red line) algorithms. Error bars indicate the standard deviation of AUROC distribution.

