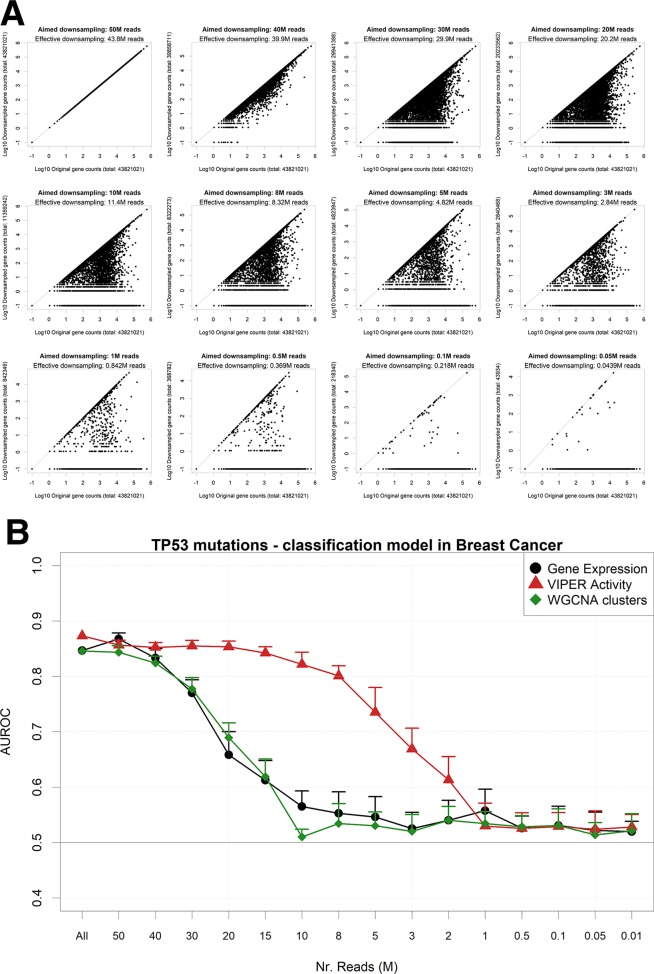
Figure 5.
Performance of a TP53 mutation gbm model upon down-sampling of the TCGA breast cancer RNA-Seq dataset. (A) for a single TCGA sample (TCGA-A1-A0SB-01) with 43.8 gene mapping reads, the down-sampling algorithm is applied for multiple target read quantities. X-axis shows the count for each gene in the original sample and Y-axis in the down-sampled output. (B) AUROCs of the model with decreasing read numbers, calculated using gene expression (black line) or aggregated gene expression using the WGCNA (green line) or VIPER (red line) algorithms. Error bars indicate the standard deviation of AUROC distribution. Pseudocounts of 0.1 are added in order to show zero counts as −1 in log10 scale.

