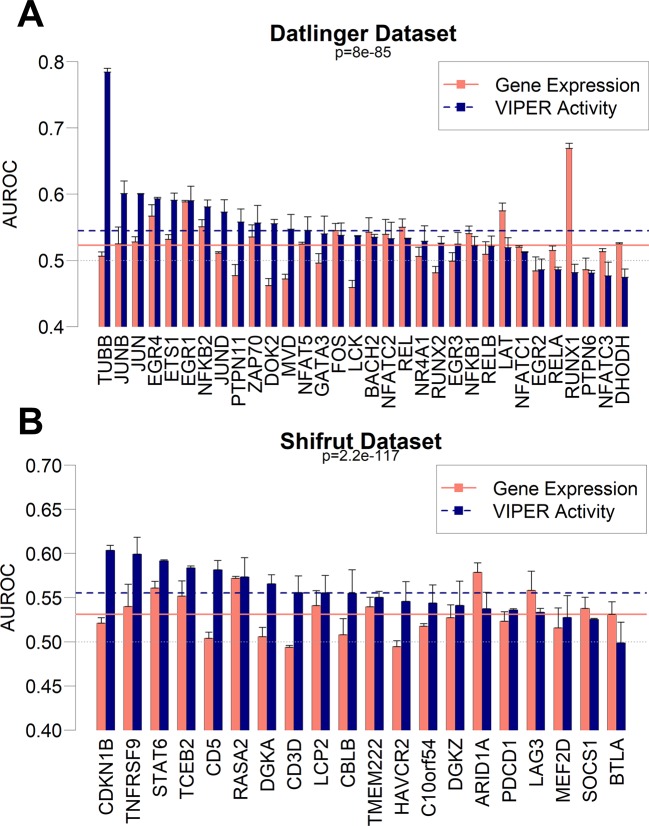
Figure 6.
Performance as AUROC of gbm models to predict mutations in CROP-Seq datasets using gene expression (red bars) and VIPER activity (blue bars) derived from CCLE expression data in Datlinger (A) and Shifrut (B) datasets. The p-value of paired Wilcoxon tests between all VIPER and expression AUROCs in each dataset is reported, as well as the average of all expression models (red solid line) and all VIPER activity models (blue dashed line). Error bars report the standard deviation of 100 AUROCs generated from multiple partitioning of training/test sets. Error bars indicate the standard deviation of AUROC distribution.

