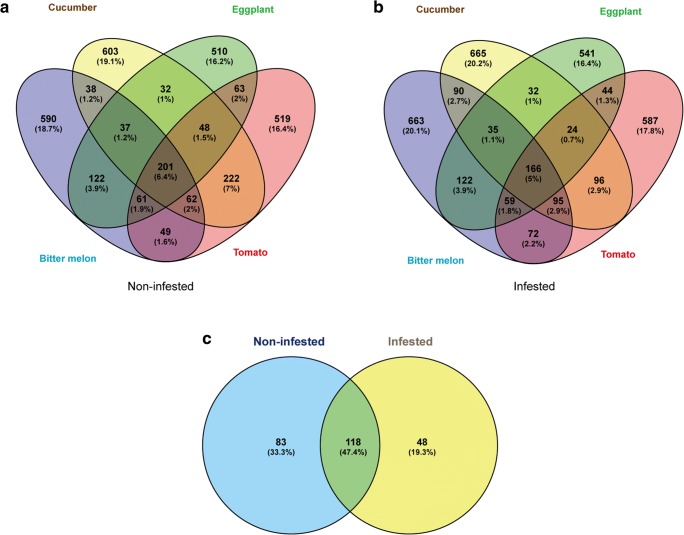
Fig. 4.
Venn diagram showing distribution of OTUs among different soil samples. a 201 OTUs shared across all the non-infested soil samples. b 166 OTUs shared across all the infested soil samples. c 118 OTUs shared across the non-infested and infested soil, 83 OTUs uniquely found in non-infested soil and 48 OTUs uniquely found in infested soil. Classifications of the shared OTUs are shown in Table S1

