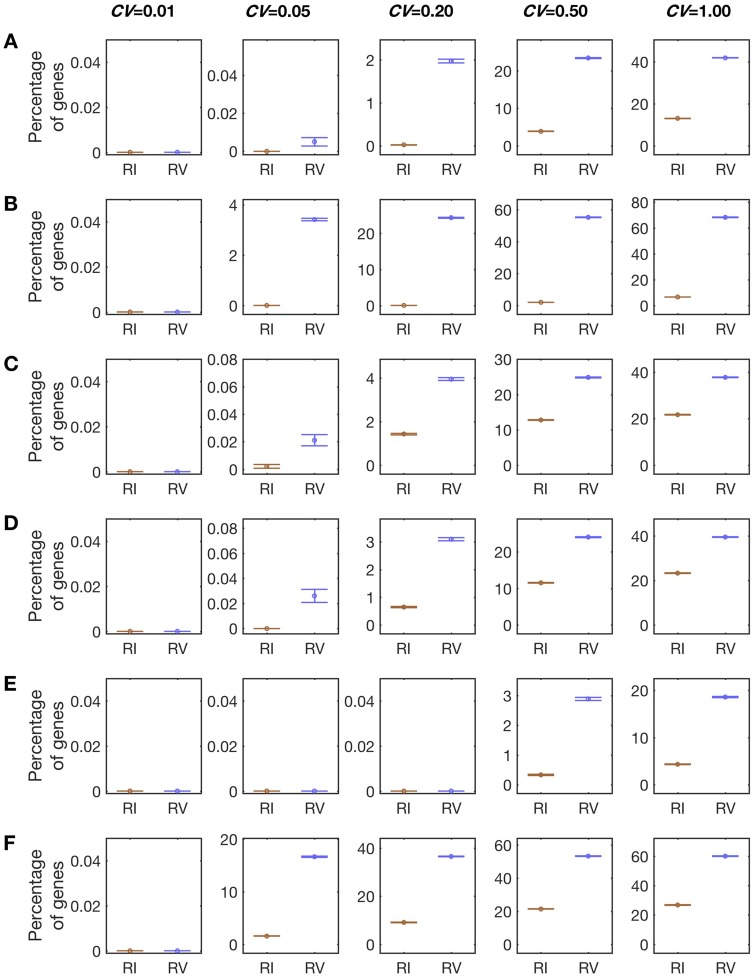
Fig. 1.
Rates of false identification of gene expression RV and RI estimated by computer simulation. The mean expression level (μ) used = 100. The CV used is marked on the top of each column. Each row has a different combination of the cutoff (c) and numbers of replicates at the original (no), plastic (np), and adapted (na) stages. Results shown are means and standard errors estimated from 100 rounds of simulation, each containing 1,000 hypothetical genes with the same μ and CV. See main text for definitions of RV and RI. (A) Simulation results under no = 6, np = 6, na = 6, and c = 0.2Lo, where Lo is the observed mean expression level at stage o. (B) Simulation results under no = 6, np = 1, na = 6, and c = 0.2Lo. (C) Simulation results under no = 1, np = 6, na = 6, and c = 0.2Lo. (D) Simulation results under no = 6, np = 6, na = 1, and c = 0.2Lo. (E) Simulation results under no = 6, np = 6, na = 6, and c = 0.5Lo. (F) Simulation results under no = 6, np = 6, na = 6, and c = 0.05Lo.

