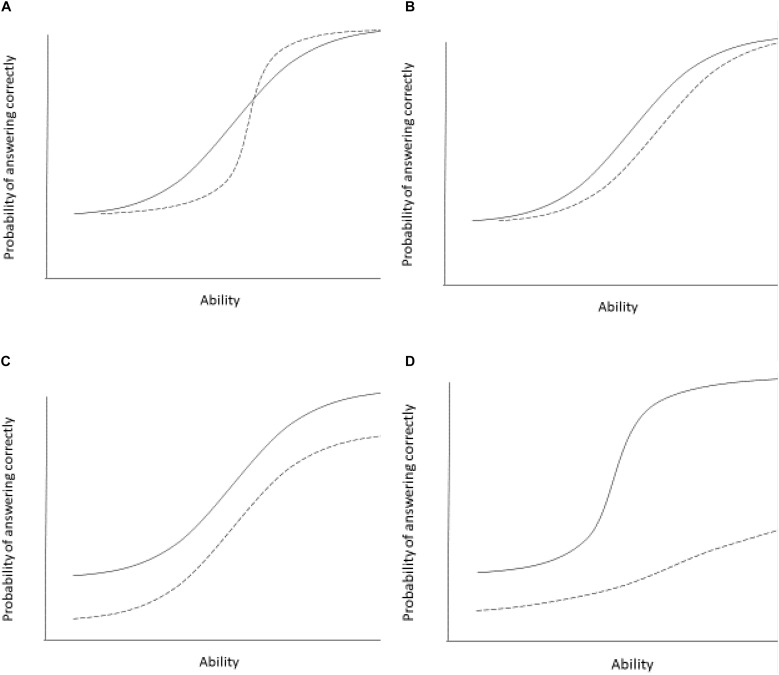
FIGURE 2.
Examples of differential item functioning in two groups. The panels show differential item functioning curves for two groups (group 1 indicated by solid line, group 2 indicated by a broken line). Panel (A) shows two groups differing in item discrimination (slope differences). The item differentiates individuals less well in group 1. This is an example of non-uniform item bias. Panel (B) shows two groups with different item difficulty. The item is easier (individuals with lower ability are able to correctly answer the item with 50% probability) for the group 1 and more difficult for group 2. Individuals in group 2 need higher ability to answer the items correctly with a 50% probability. This is an example of uniform item bias. Panel (C) shows differential guessing or intercept parameters. Group 1 has a higher chance of guessing the item correctly compared to group 2. Scores for group 1 on this item are consistently higher than for group 2, independent of the individual’s underlying ability or trait level. This is an example of uniform item bias. Panel (D) shows two groups differing in all three parameters. Group 1 has a higher guessing parameter, the item is easier overall, but also discriminates individuals better at moderate levels of ability compared to group 2. This is an example of both uniform and non-uniform item bias.

