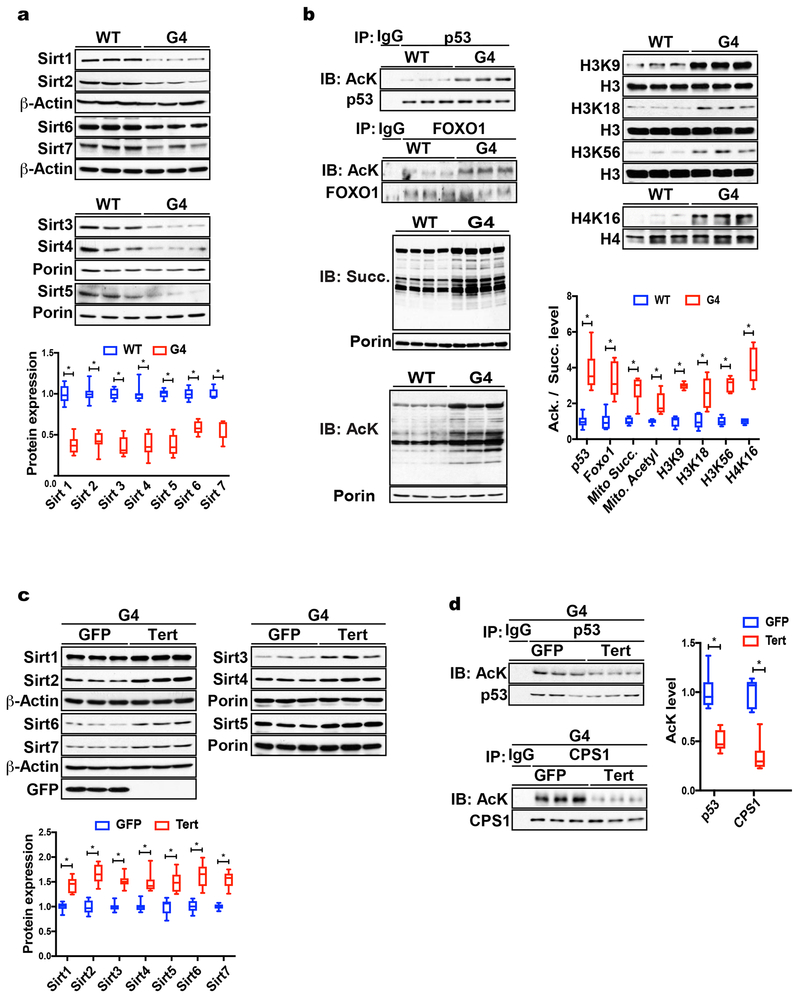
Fig. 1. Telomere dysfunction leads to sirtuin repression and hyperacetylation of sirtuin targets.
(a) Western blot demonstrates that Sirt1-7 are significantly down-regulated in G4 liver tissue (9 mice per group analyzed; shown are 3 representative mice per group); (b) IP-western blot analysis shows acetylation of targets of Sirt1 (p53, Foxo1), Sirt2 (H3K56, H4K16) Sirt3 (mitochondrial protein acetylation), Sirt5 (mitochondrial protein succinylation), Sirt6 (H3K9 and H3K56) and Sirt7 (H3K18) are increased in G4 liver tissue (shown are 3 representative results per group; a total of 9 mice per group were analyzed); (c) Western blot analysis of liver tissue from G4 mice infected with adenovirus expressing either telomerase (“Tert”) or GFP control shows that reactivation of telomerase increases sirtuin protein levels in G4 liver tissues (shown are 3 representatives per group; a total of 9 mice per group were analyzed); (d) telomerase reactivation decreases acetylation levels of Sirt targets compared to GFP-Adenovirus control group (9 mice per group were analyzed); Results are quantified by densitometry and expressed as mean ± s.e.m.; t-test was used to determine statistical significance with p <0.05 considered as significant, as indicated by (*).

