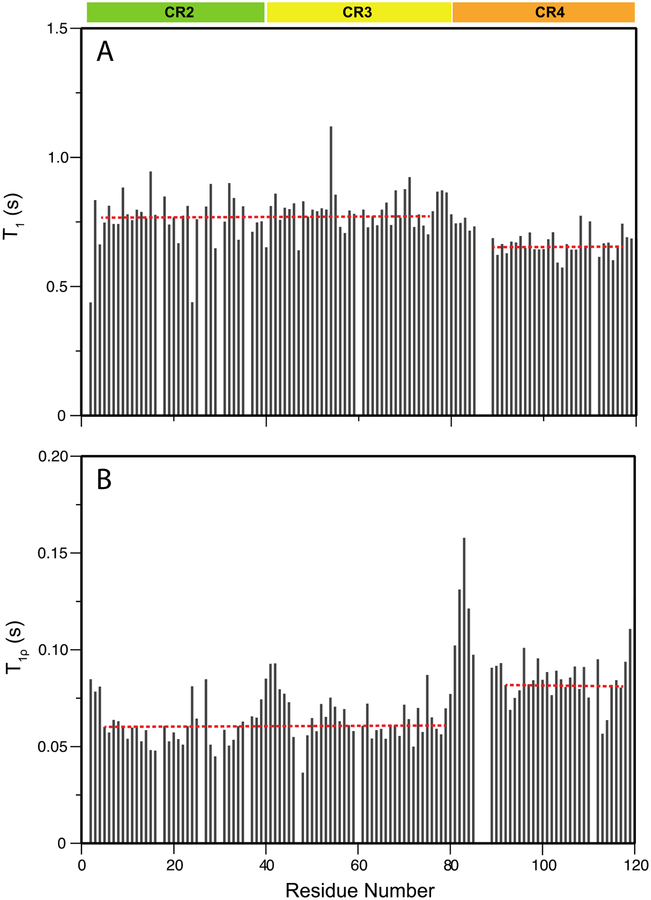
Figure 3.
Backbone dynamics of the VLDLR(2–4) fragment. Panels (A) and (B) show the experimental values of 15N T1 and T1ρ, respectively, for VLDLR(2–4). Regions belonging to different CR domains are indicated at the top of the panel in bars with three different colors, green, yellow, and orange. The horizontal dotted red lines show the average T1 and T1ρ values obtained by averaging the experimental data over all residues in CR2–3 and CR4. Residues in highly flexible loops are excluded from the calculation of the average values.

