
Figure 3.
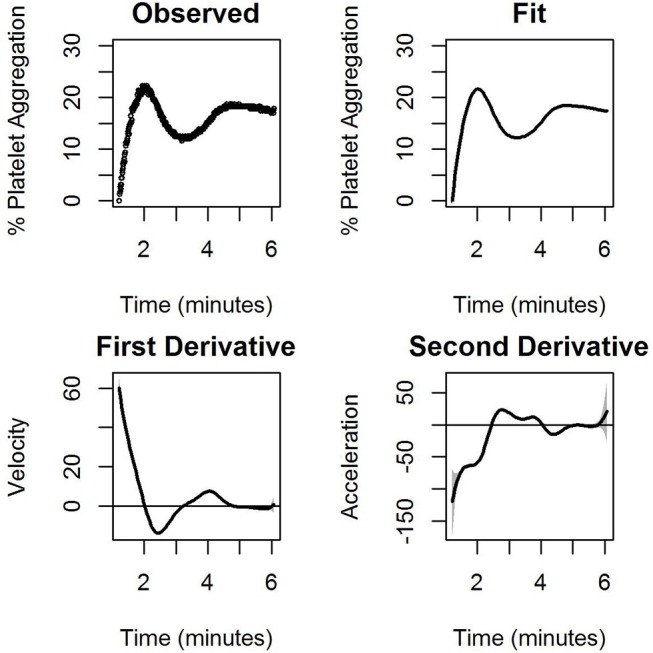
The observed percentage of platelet aggregation over time in response to administration of 1.32 μM of ADP together with model based estimates of the mean percentages, and point wise first and estimated second derivatives of the mean curve. The first derivative measures the velocity of aggregation while the second derivative measures the corresponding acceleration. A horizontal line indicating zero velocity and acceleration is also plotted for reference. The gray shaded region is the 95% confidence interval.