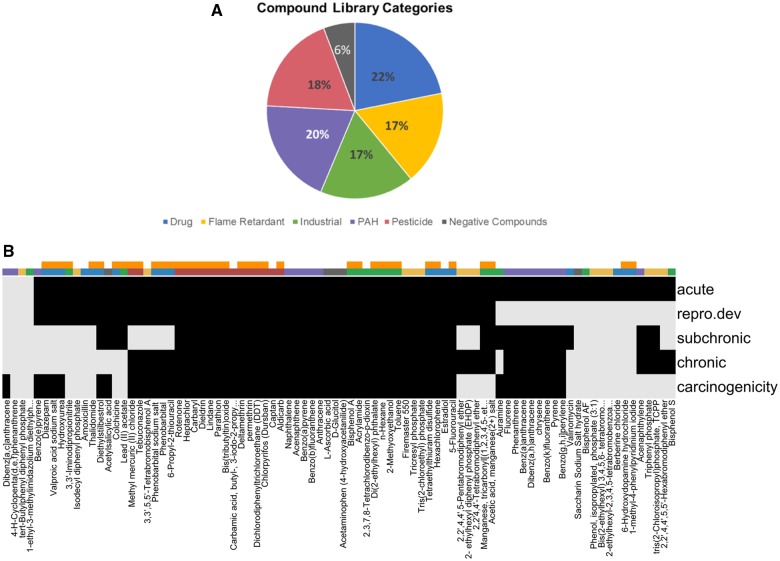
Figure 1.
The NTP91 compound library. A, Pie chart of the NTP compound library, by use category (percent of total). As shown in the figure, we had a fairly uniform distribution of drugs (blue), flame retardants (yellow), industrial compounds (green), polycyclic aromatic hydrocarbons (PAH, purple), and pesticides (pink). B, Heat map identifying whether the compound has (black bars) or has not (light gray bars) been evaluated in a variety of systems toxicity assays. Data were derived from the EPA Chemistry Dashboard and Leadscope. Color bars indicate (i) if the compound has evidence of in vivo DNT or NT by NTP literature review (orange) and (ii) use category (eg, flame retardant [yellow]) repro. dev., reproductive and developmental.

