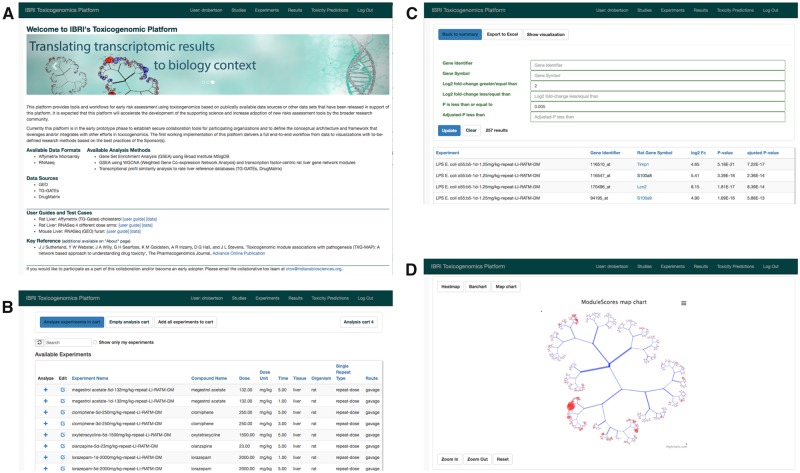
Figure 1.
Illustrating key functionality in the CTox web application. A, Background and user guide links when accessing the application. B, Dialog for searching and adding experiments of interest to an analysis “cart.” C, Viewing gene-level results for experiments in the analysis cart. D, Visualization of co-expression results on the TXG-MAP (see Results section).

