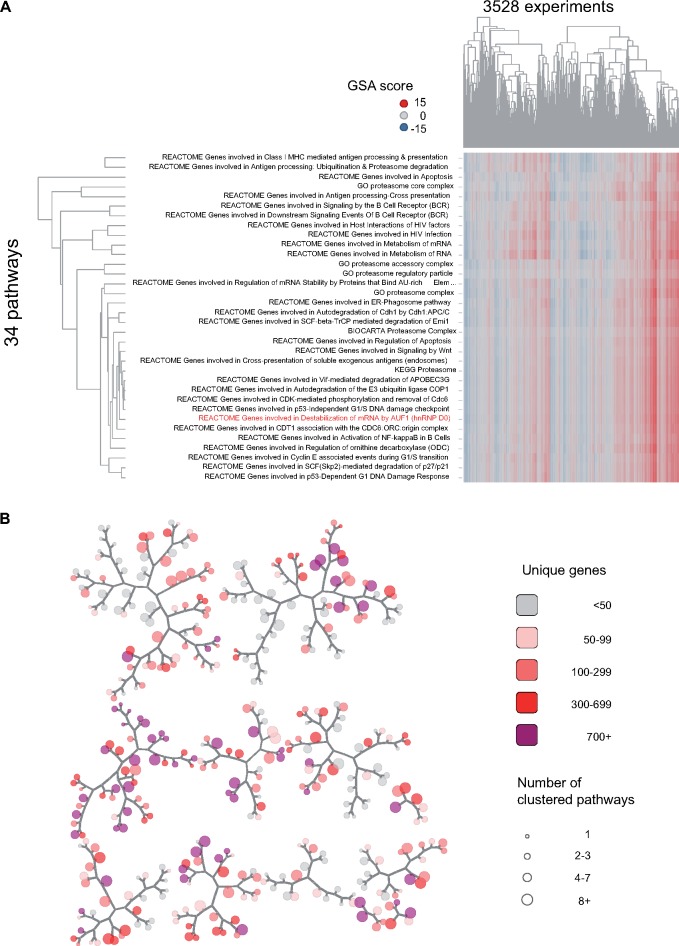
Figure 2.
Network map of nonredundant inducible pathways in rat liver. The full set of 1839 inducible/repressible pathways was clustered using gene set analysis scores for 3528 TG liver experiments; (A) showing 1 cluster (cluster 1578), which includes 30 pathways and 4 GO-CC terms (all relating to the proteasome) with highly correlated scores (see Materials and Methods section). One pathway (REACTOME Genes involved in Destabilization of mRNA by AUF1) best captured the variation in scores for all terms and was selected as a representative for the cluster. Other selections, based on maximal perturbation across experiments of interest, or most significant association with a toxicity phenotype are possible. The grouping is based solely on correlation of pathway scores, not gene membership or biological themes among the gene sets. B, The set of 1839 pathways reduced to 382 clusters, with each cluster represented as a node on the map; the cluster in (A) is represented as 1 node on the map. Proximity in the map, as measured by traversal of branches, corresponds to correlation of scores between clusters. Clusters range in size from 1 through 92 gene sets (node size), and when counting all unique genes among their members, include from 5 to 2039 unique genes (shading).

