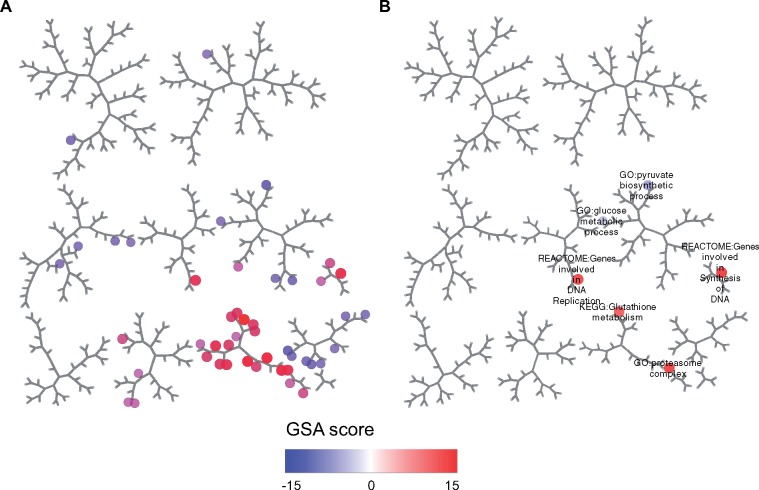
Figure 3.
Pathways perturbed by omeprazole treatment in rat liver. Expression results were analyzed for omeprazole 24 h following the administration of single doses of 300 and 1000 mg/kg. A, Only pathways with gene set analysis score p-adj < .001 at both doses were retained. Within each of 382 pathway clusters, the pathway with the highest average absolute score across the 2 doses was selected. B, Only the subset of 8 pathways ranked in the top 50 out of 1839 for association with hypertrophy was considered.

