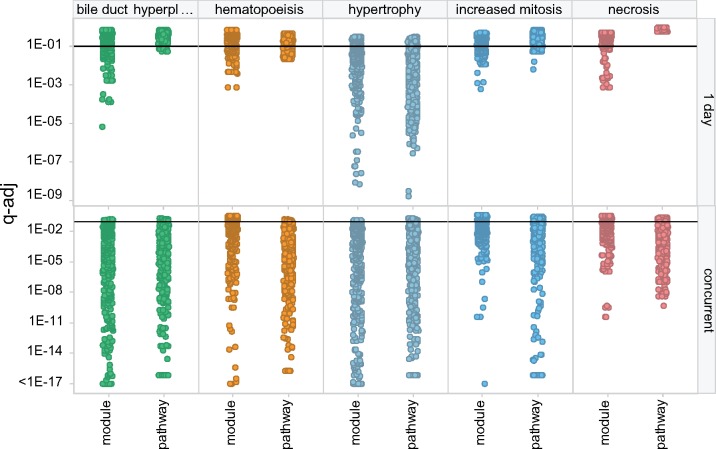
Figure 5.
Module and pathway association with toxicity phenotypes. For selected toxicity phenotypes (trellis panel columns), the significance of the relationship (q-adj) between module/pathway scores and occurrence of toxicity is shown for predictive applications (ie expression analysis at 1 day) and concurrent with injury (trellis panel rows). Small q-adj values indicate greater significance. The horizontal line at q-adj = .1 denotes a common cutoff for statistical significance. Points are jittered horizontally for clarity.

