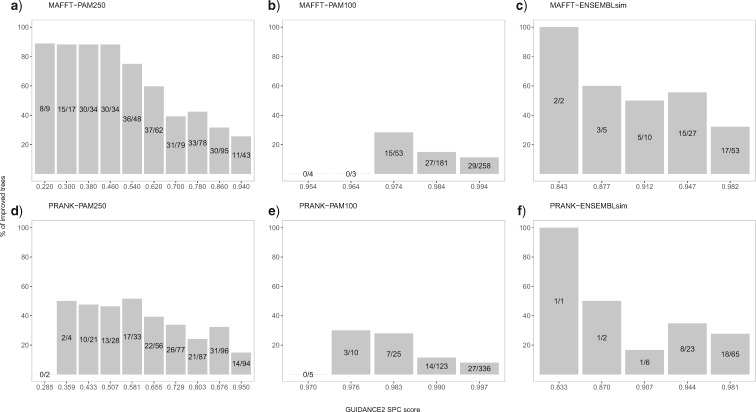
Figure 4.
The fraction of improved trees when considering alternative MSAs as a function of the base MSA accuracy scored by GUIDANCE2. Base MSAs were divided into bins according to their GUIDANCE2 SPC score, where lower scores represent less accurate MSAs. The number of improved trees and the total number of trees are indicated inside the bar for each bin. Each data set is plotted separately: MAFFT-PAM250 (a), MAFFT-PAM100 (b), MAFFT-ENSEMBLsim (c), PRANK-PAM250 (d), PRANK-100 (e), and PRANK-ENSEMBLsim (f).

