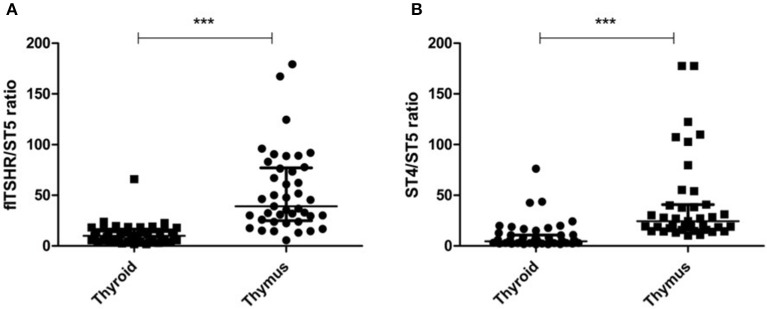
Figure 3.
Proportionally lower expression of the TSHR ST5 isoform in the thymus compared with the thyroid. The expression ratios of ST5 with flTSHR (A) and ST4 (B) in the thymus and thyroid were calculated. Each point represents the mean value of triplicate results from one sample. The median ± IQR of each group is shown. ***p < 0.0001 using a t-test for independent samples.

