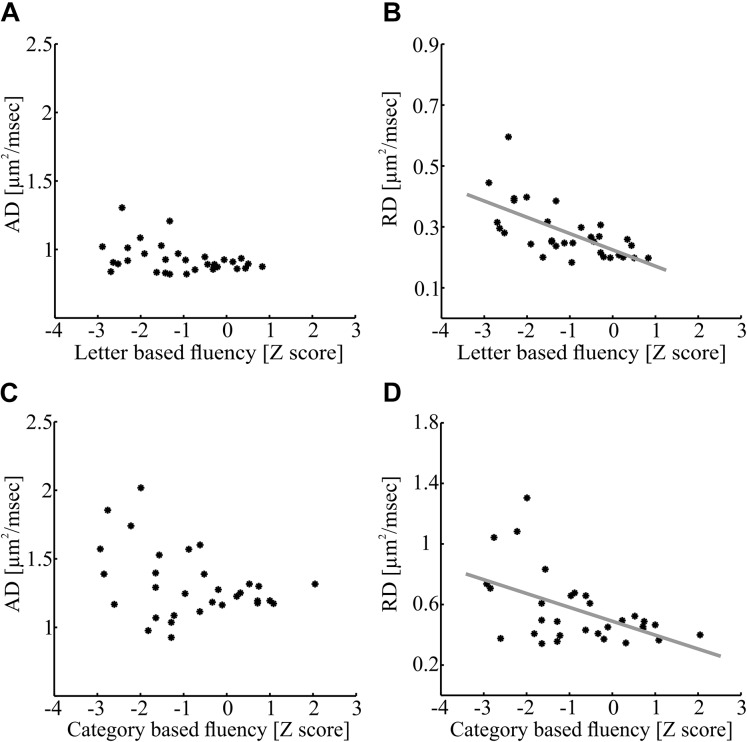
FIGURE 6.
Axial diffusivity and RD correlations with fluency measures within significant clusters. (A,B) Correlations between letter-based fluency and diffusivity measures along the left AFft. Mean AD (A) and RD (B) values of the significant cluster depicted in Figure 5A (nodes 48–100) are plotted against the letter-based fluency scores for each participant (N = 32; A: p > 0.05; B: p < 0.0001). (C,D) Correlations between category-based fluency and diffusivity measures along the right IFOF. Mean AD (C) and RD (D) of the significant cluster depicted in Figure 5C (nodes 75–91) is plotted against the category-based fluency scores for each participant (N = 31; C: p > 0.05; D: p < 0.005). AFft, fronto-temporal arcuate fasciculus; IFOF, inferior fronto-occipital fasciculus.

