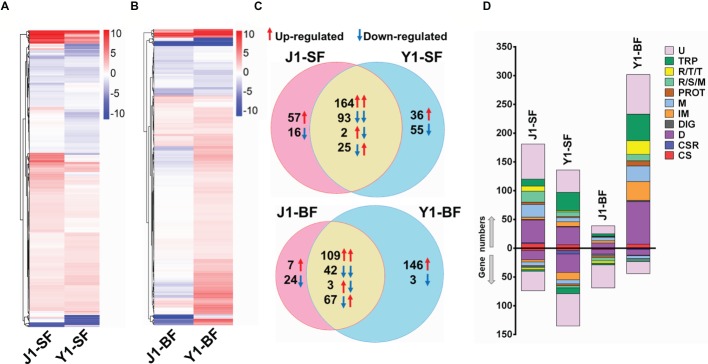
Figure 3.
Comparative analysis of transcriptional profiles in mosquito midguts challenged with Serratia Y1 or J1. (A,B) Heat maps and hierarchical clustering analysis of differentially expressed genes (DEGs) in the midgut of An. stephensi mosquitoes fed with Serratia Y1 or J1 before (SF, sugar fed) and 24 h after blood meal (BF, blood fed). DEGs in each group were identified with log 2 (fold change) of ≥1 (p < 0.05) by comparison of transcript abundance between bacteria challenged and aseptic mosquitoes. Colors from white to red indicate up-regulation; colors from white to blue indicate down-regulation. (C) Venn diagram showing the number of shared and specific DEGs in the midgut of mosquitoes fed with Serratia Y1 or J1 before and 24 h after blood meal. Red and blue arrows indicate the mosquitoes challenged with Serratia Y1 and J1, respectively. (D) Global gene regulation in the different groups. Proportions and numbers of genes belonging to distinct functional groups were up- (red arrow) or down-regulated (blue arrow) in the corresponding groups. U, unknown functions; TRP, transport; R/T/T, replication, transcription, translation; R/S/M, oxidoreductive, stress-related and mitochondrial; PROT, proteolysis; M, metabolism; IM, immunity; DIG, digestion; D, diverse; CSR, chemosensory protein; CS, cytoskeletal, structural.

