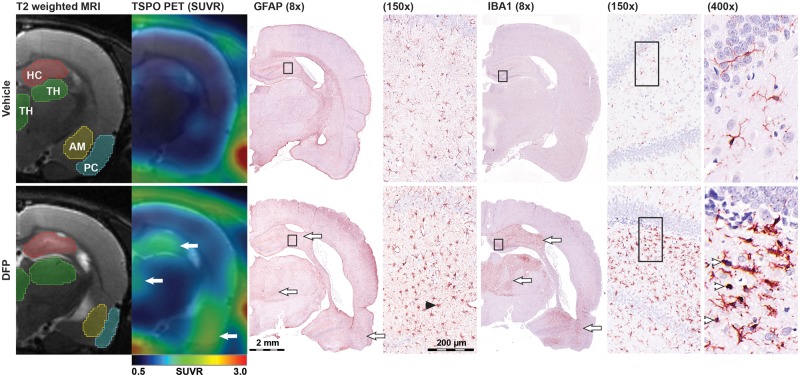
Figure 4.
TSPO PET imaging corresponds spatially with immunohistochemical evidence of neuroinflammation. Images from a VEH control (top) and DFP-intoxicated animal (bottom) demonstrate spatial correspondence between areas of increased [18F]PBR111 uptake and regions of severe microgliosis and astrogliosis as assessed by IBA1 and GFAP immunoreactivity respectively. The same animal analyzed by (from left to right): T2-weighted MRI to illustrate the VOI delineation of the hippocampus (HC, red), thalamus (TH, green), amygdala (AM, yellow), and piriform cortex (PC, cyan) used to calculate the regional [18F]PBR111 SUV metrics; parametric images of [18F]PBR111 SUVR (color) overlaid on MRI (grayscale); composite micrographs (montaged from 20× to 400× tiled images) of GFAP (8× and 15×), and IBA1 (8×, 15×, and 400×) immunostaining. White arrows denote areas of coincident increases in [18F]PBR111 SUVR, IBA1 immunoreactivity, and GFAP immunoreactivity in the hippocampus (top arrow), thalamus (middle arrow), and piriform cortex (bottom arrow) following acute DFP intoxication. Arrowheads on insets denote examples of activated microglia (white) and astrocytes (black). Note: similar inflammation is not observed in the VEH control. All panels are located approximately 4 mm bregma.

