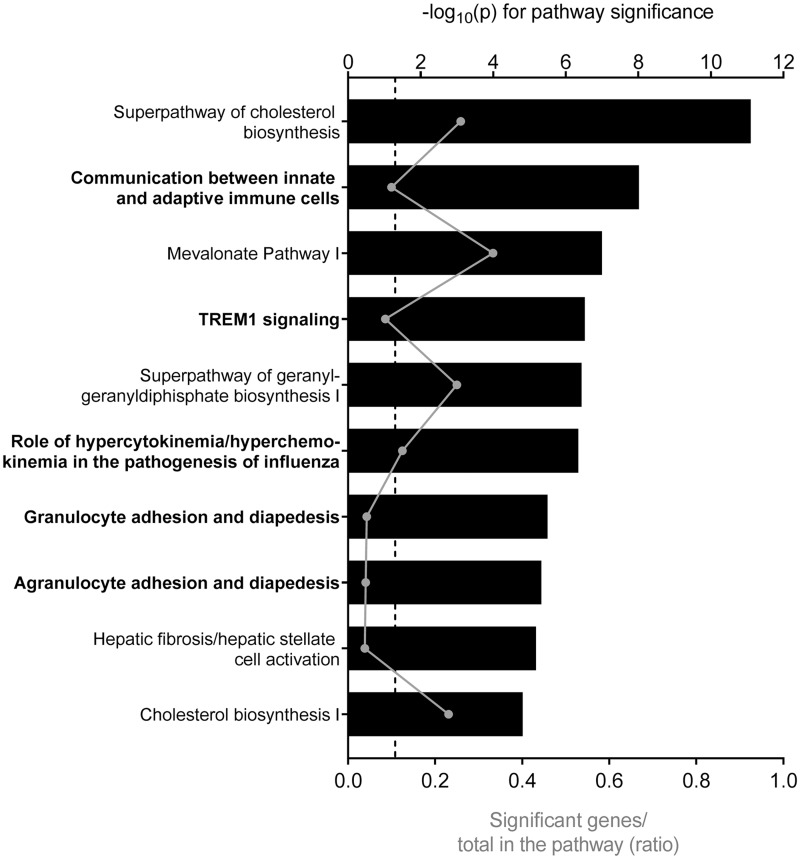
Figure 6.
Top 10 most significantly enriched pathways among genes differentially expressed in THP-1 cells exposed to HDE compared with mock control (p < .05 and |FC|> 2.25). Pathway significance is plotted on the upper x-axis and represented by the black bars on the graphs. The ratio of significant genes to total genes in the pathway is plotted on the lower x-axis and represented by the gray dots (connected by a gray line) on the graphs. The dashed line represents a threshold for significance set at −log10(p) > 1.3. Pathways in bold are related to immune function.

