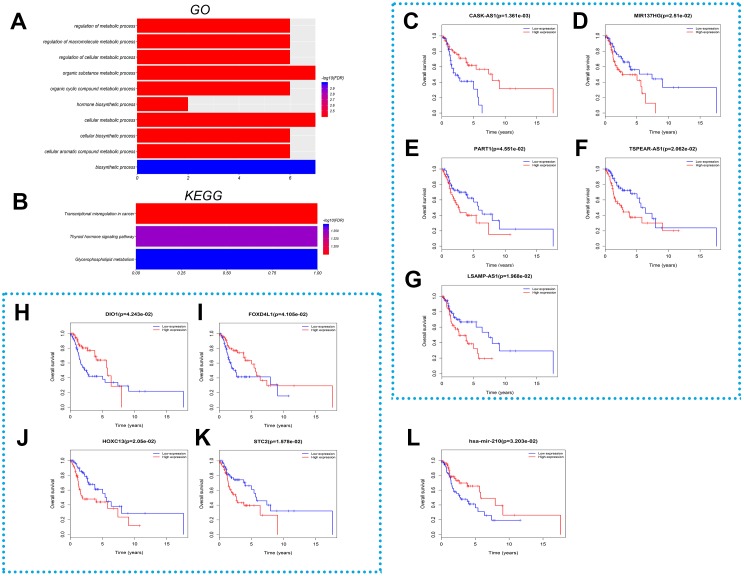
Figure 4. Function and survival analysis of RNAs in the ceRNA network.
(A) Significant bioprocesses and (B) pathways representing the functions of mRNA in the ceRNA network. The horizontal axis stands for the number of enriched genes and the color intensity represents corrected P-value. Kaplan–Meier curves analysis of differentially expressed (C–G) lncRNAs, (H–K) mRNAs and (L) miRNA for the overall survival in LSCC patients. The horizontal axis represents overall survival time (years), while the vertical axis represents survival function.

