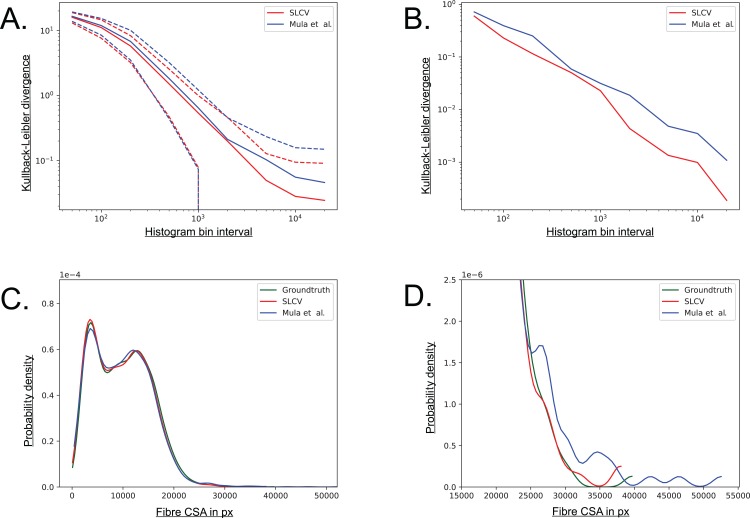
Figure A5. Visualisation of the combined cell separation-area reconstruction error.
(A) Kullback–Leibler divergence of SLCV and Mula et al. reconstructed cell area distributions from groundtruth cell area distribution. Solid line represents the mean KL divergence over all images, dotted lines represent the standard deviation. Both axes are plotted logarithmically. (B) Kullback–Leibler divergence of SLCV and Mula et al. reconstructed cell area distributions from groundtruth cell area distribution of all images. (C) Kernel density estimation of cell areas over all images. (D) Zoomed in tail region from C.

