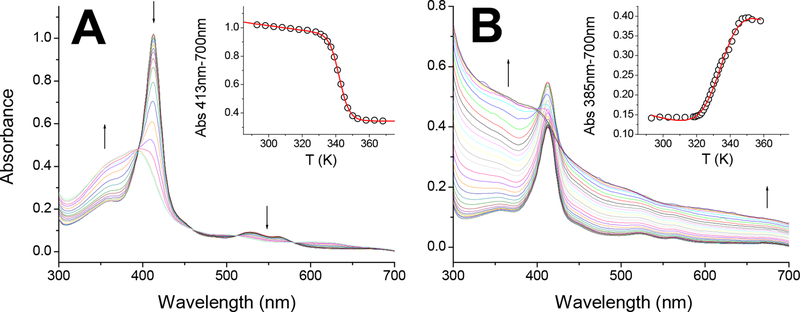
Figure 5. Thermal denaturation of zebrafish Cytochrome b5a and cytochrome b5b.
Panel A, CYB5a; Panel B, CYB5b. The spectra obtained at increasing temperatures (20–95 °C) are shown, the direction of the absorbance changes is indicated by arrows. The insets show the changes in the Soret peak absorbance with the temperature and the fit of the absorbance changes to the Santoro-Bolen equation (red lines).

