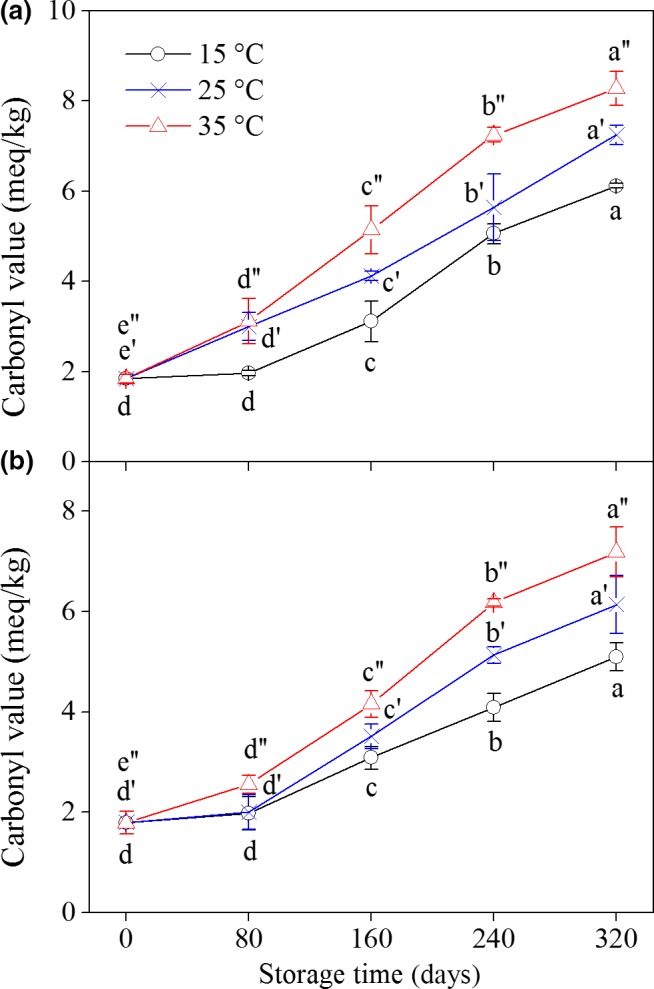
Figure 3.

Changes in carbonyl value of peanuts during storage at different temperatures. (a): YH‐9326; (b): YH‐22. Each data point represents the mean of three replicate samples. Vertical bars represent the standard errors of means. Values of each peanut cultivar followed by the same letter are not significantly different (p ˃ 0.05)
