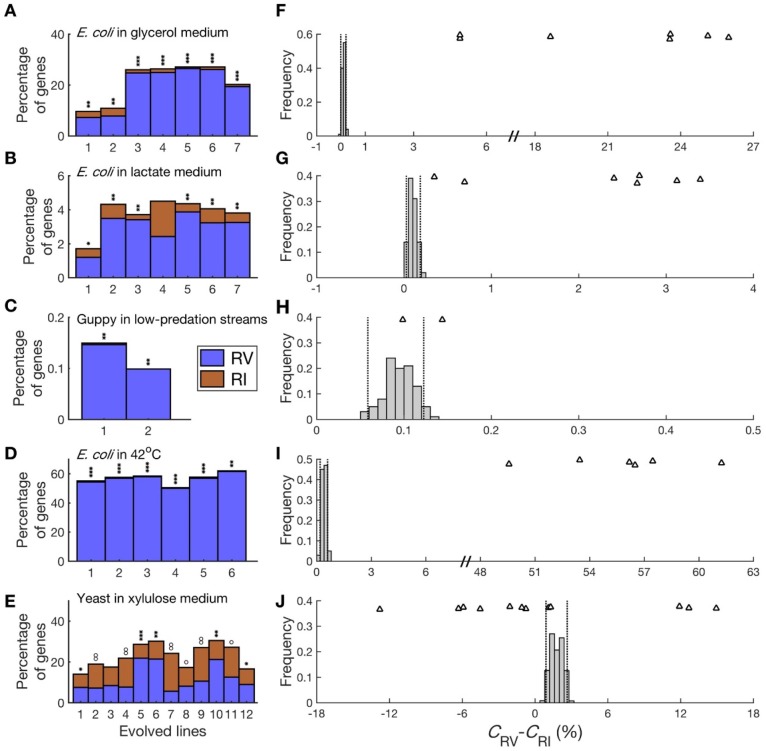
Figure 3.
The figure legend is the same as originally published, with the following addition. In panels (A)-(E), when δ = CRV − CRI > 0: *, P < 0.05; **, P < 10−10; ***, P < 10−100; when δ < 0: o, P < 0.05; oo, P < 10−10; ooo, P < 10−100. The only substantial changes are in panels (E) and (J). In the 12 lines of budding yeast adapting to the xylulose medium, five show a significantly positive δ and six show a significantly negative δ (Fig. 3E). Three values of δ are in the right 2.5% tail of the distribution of δ in 100 simulations, whereas seven values of δ are in the left 2.5% tail (Fig. 3J). Overall, data from four of the five experimental evolution studies support the excess of expression reversion over reinforcement.

