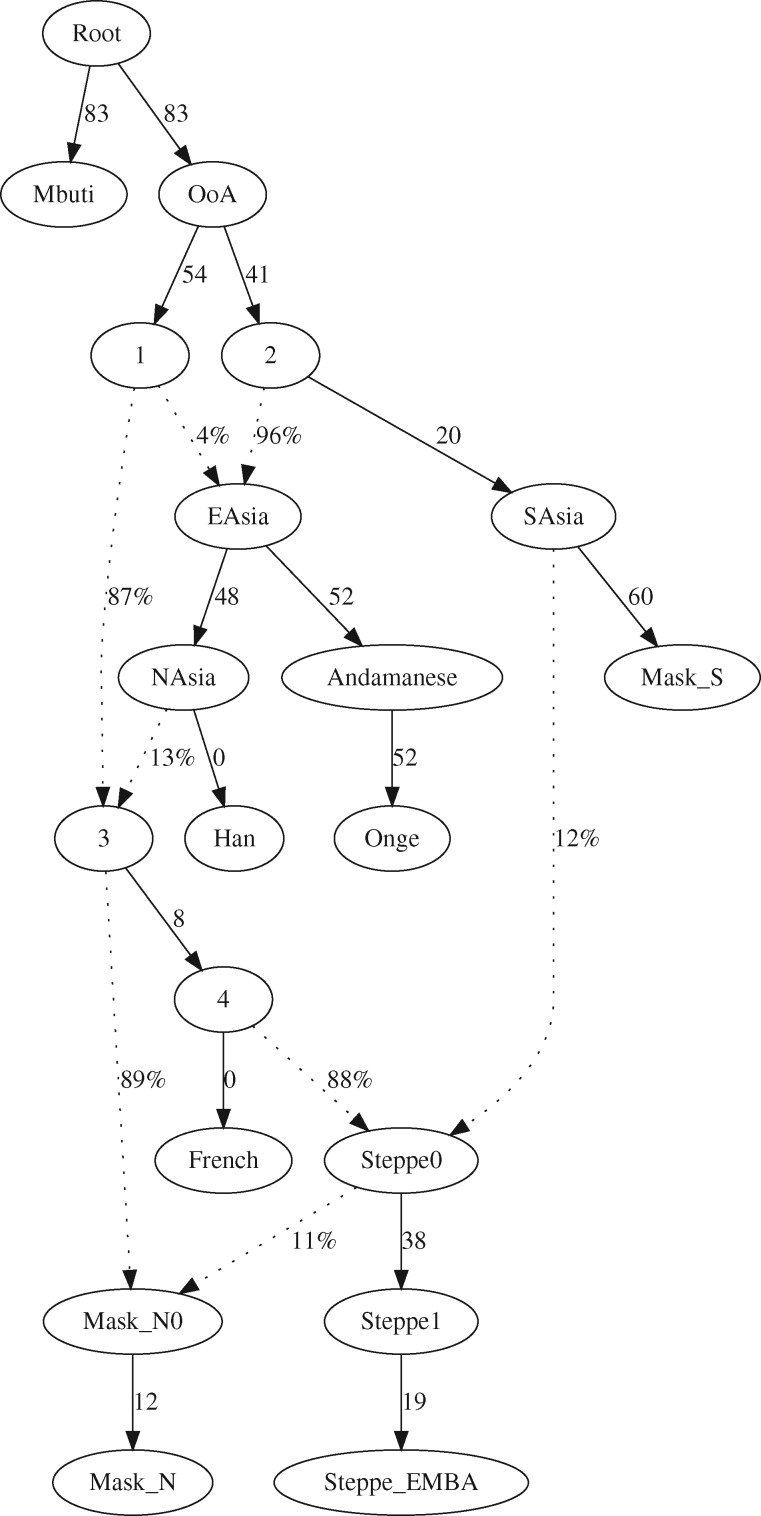
Fig. 2.
qpGraph model of N and S ancestries. The qpGraph reported here places the obtained N and S deconvoluted ancestries (represented here by Gujaratis_N and Irula_S, respectively) within the broader scenario of within Eurasia splits and subsequent admixtures. Alternative trees involving a different Onge/Han/S split order, or a reverse Steppe_EMBA – S admixture direction yielded f4 outliers and an overall poorer fit. Final score: 3,061.001, degrees of freedom: 2, no f2 outliers, no f4 outliers, worst f-stat: 1.747.

