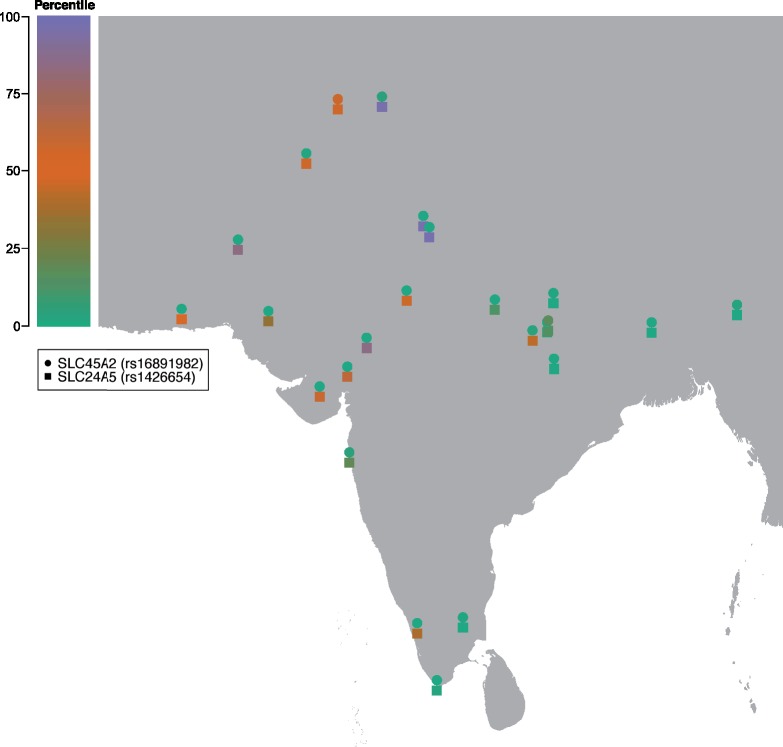
Fig. 4.
Admixture imbalance (AHFD) percentile values of ten SNP windows including the rs1426654 (SLC24A5, squares) and rs16891982 (SLC45A2, dots) markers. The window including the SLC45A2 marker is in the bottom (green) percentile of most South Asian populations, hence showing a significant excess of the S haplotypes compared with the genome-wide average per population. The window including the SLC24A5 marker shows instead a more balanced pattern, showing moderate to high scores (orange to purple, hence toward an excess of N haplotypes) in West and North South Asia and orange to green (hence toward a prevalence of S haplotypes) in East and South Asia.

