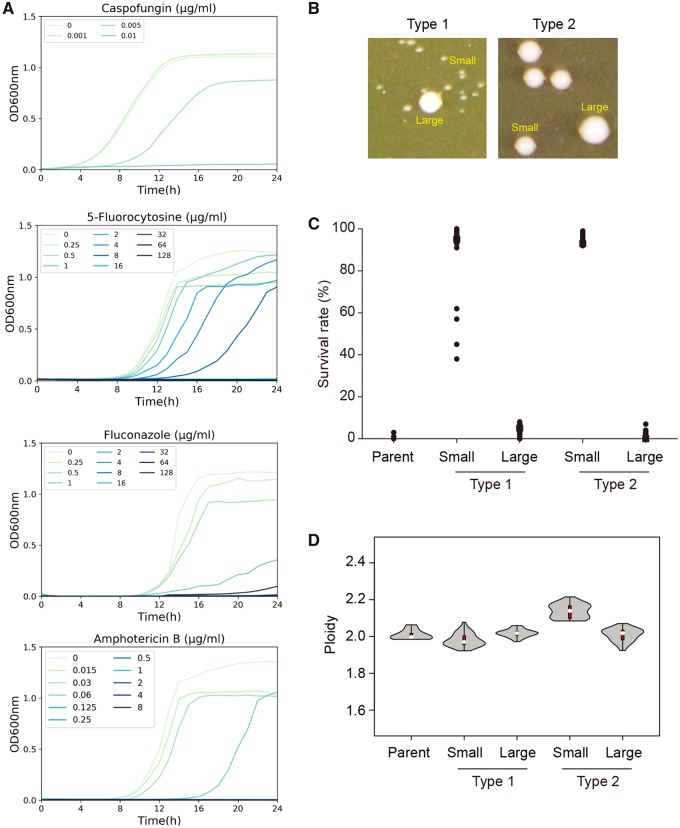
Fig. 2.
Candida albicans survivors of antifungal drugs show unstable colony phenotypes and variable ploidy levels. (A) Dose–response curves of C. albicans SC5314 exposed to caspofungin (CSP), 5-flucytosine (5-FC), fluconazole (FLC), and amphotericin B (AMB). Cell growth was monitored at intervals of 15 min in 96-well microtiter plates at 37 °C for 24 h. Data shown are the average of three technical repeats. (B) A range of colony sizes, primarily small with a few larger colonies, were evident when individual strains that survived 100 ng/ml CSP were replated onto rich medium with no drug (YPD). Based on the size difference between small and large colonies, two types of strains, as indicated, were distinguished. (C) Ability of small and large colonies, from (B), to survive (i.e., to form colonies) in 100 ng/ml CSP. Survival rate was determined as the percentage of colonies growing on 100 ng/ml CSP after 2 days of growth at 37 °C out of the total number of colonies that appeared on YPD medium without drug. (n = 32 and n = 28 for Type 1 and Type 2 strains, respectively.) (D) Range of ploidy levels, determined by flow cytometry analysis of DNA content, in cells that survived exposure to 100 ng/ml CSP. The ploidy distributions are shown as violin plots. The interquartile range is represented by a red box, whereas the median value is indicated by a white dot. (n = 8, 32 and 28, for the parental strain, Type 1 strains and Type 2 strains, respectively.)

