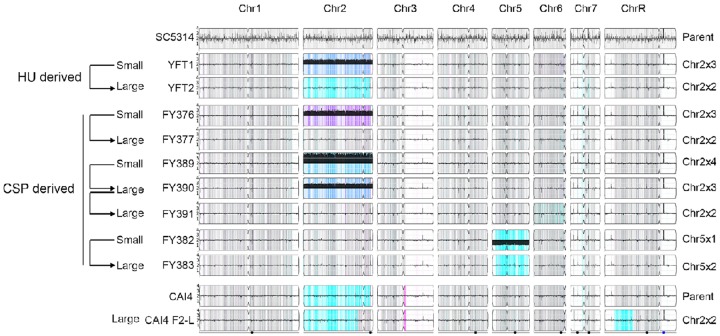
Fig. 3.
YMAP analysis of DNA content and allele ratios for HU and CSP survivor colonies reveals recurrent aneuploidies. Whole-genome DNA sequences for parents and the derived HU or CSP survivors were analyzed and displayed using YMAP (Abbey et al. 2014). Arrows on the left indicate the relationship between strains and the colonies derived from them. Relevant karyotype information is summarized to the right of each map. Read depth (normalized to that of the diploid parent) is shown on the y-axis on a log2 scale converted to absolute copy numbers (1–4). Allelic ratios (A:B) are color-coded: gray, 1:1 (A/B); cyan, 1:0 (A or A/A); magenta, 0:1 (B or B/B); purple, 1:2 (A/B/B); blue, 2:1 (A/A/B); light blue, 3:1 (A/A/A/B). The karyotype of strain CAI4 F2, which is euploid except for Chr2x3, was previously published and therefore not included in this analysis (Selmecki et al. 2005; Abbey et al. 2011).

