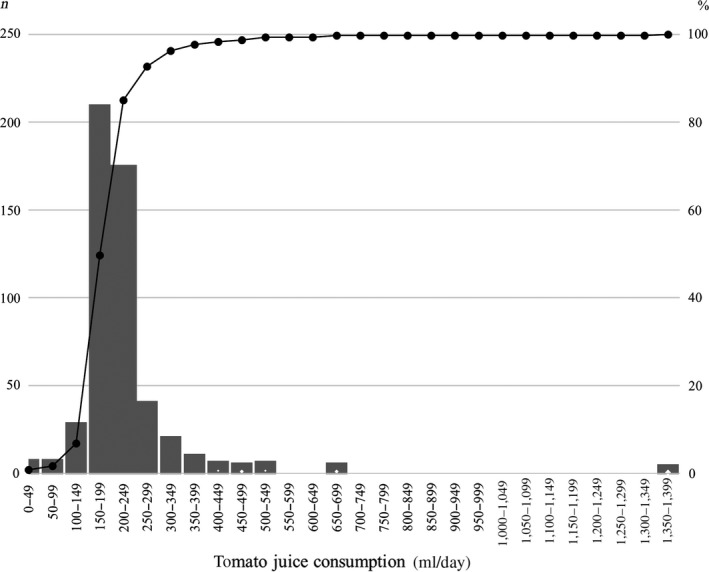
Figure 2.

Average daily tomato juice consumption and cumulative frequency: The number of participants for each segment of daily tomato juice intake (x‐axis) is represented in bars on the left‐hand axis. The line and right‐hand axis show the cumulative percentage
